


Investor pitch deck to raise funds from post ipo market powerpoint presentation slides
Our Investor Pitch Deck To Raise Funds From Post IPO Market Powerpoint Presentation Slides are topically designed to provide an attractive backdrop to any subject. Use them to look like a presentation pro.
Our Investor Pitch Deck To Raise Funds From Post IPO Market Powerpoint Presentation Slides are topically designed to provid..






























-

- Google Slides is a new FREE Presentation software from Google.
- All our content is 100% compatible with Google Slides.
- Just download our designs, and upload them to Google Slides and they will work automatically.
- Amaze your audience with SlideTeam and Google Slides.
-

Want Changes to This PPT Slide? Check out our Presentation Design Services
-

- WideScreen Aspect ratio is becoming a very popular format. When you download this product, the downloaded ZIP will contain this product in both standard and widescreen format.
-

- Some older products that we have may only be in standard format, but they can easily be converted to widescreen.
- To do this, please open the SlideTeam product in Powerpoint, and go to
- Design ( On the top bar) -> Page Setup -> and select "On-screen Show (16:9)” in the drop down for "Slides Sized for".
- The slide or theme will change to widescreen, and all graphics will adjust automatically. You can similarly convert our content to any other desired screen aspect ratio.
Compatible With Google Slides

Get This In WideScreen
You must be logged in to download this presentation.


Do you want to remove this product from your favourites?
PowerPoint presentation slides
Deliver this complete deck to your team members and other collaborators. Encompassed with stylized slides presenting various concepts, this Investor Pitch Deck To Raise Funds From Post IPO Market Powerpoint Presentation Slides is the best tool you can utilize. Personalize its content and graphics to make it unique and thought provoking. All the sixty two slides are editable and modifiable, so feel free to adjust them to your business setting. The font, color, and other components also come in an editable format making this PPT design the best choice for your next presentation. So, download now.

People who downloaded this PowerPoint presentation also viewed the following :
Content of this Powerpoint Presentation
Slide 1: This is the cover slide of Investor Pitch Deck to Raise Funds from Post IPO Market PowerPoint Presentation.
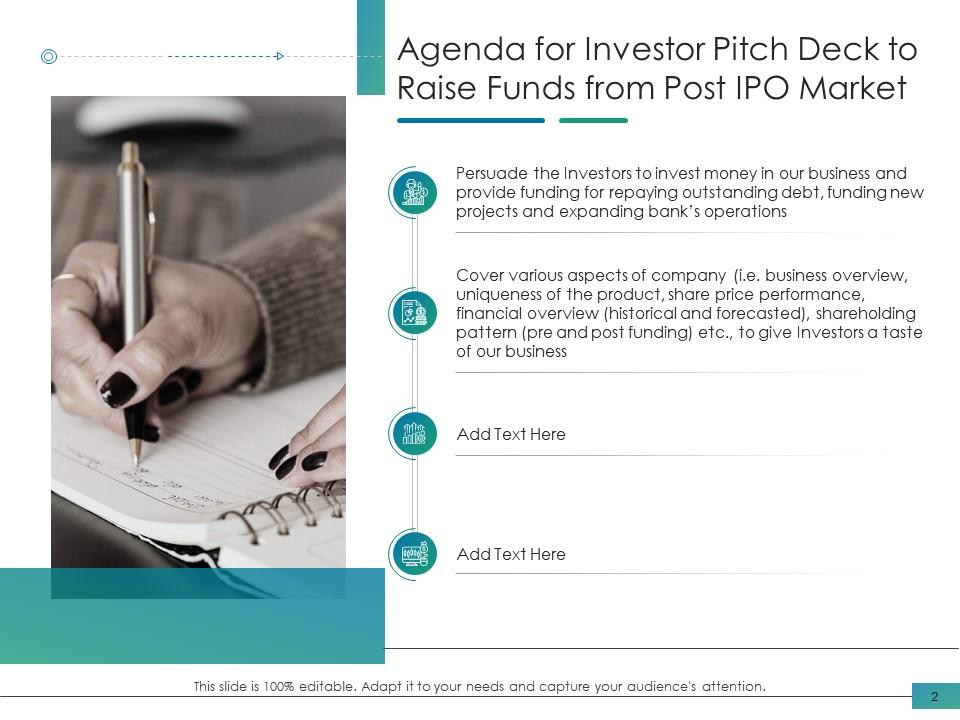
Slide 2: This is Agenda for Investor Pitch Deck to Raise Funds from Post IPO Market slide.
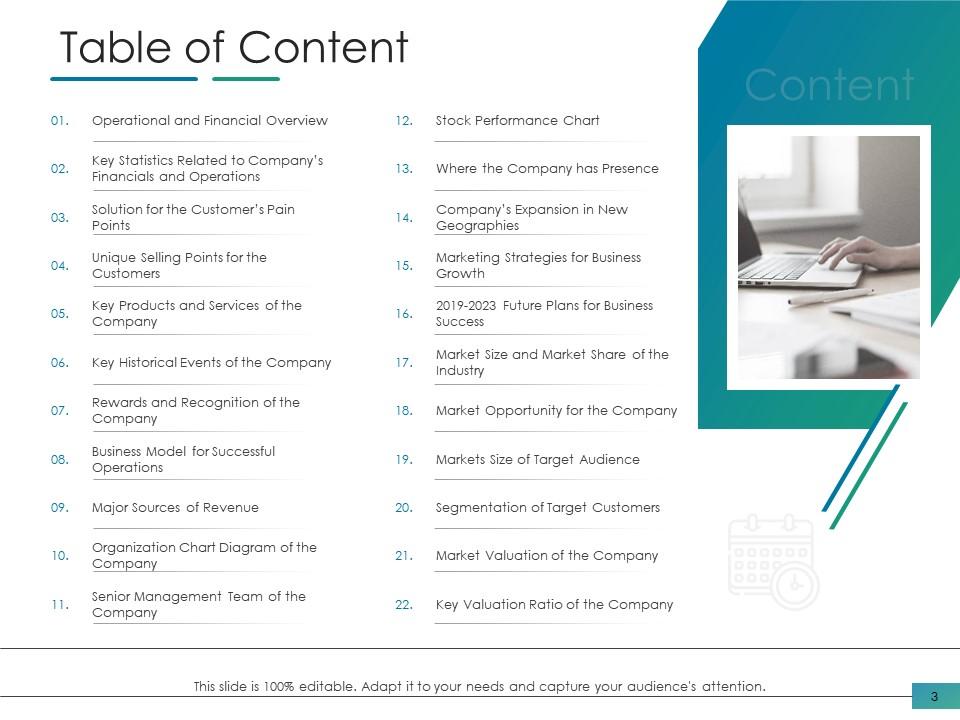
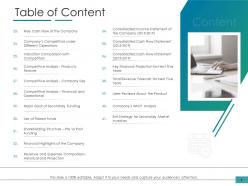
Slide 3: This is the Table of Content slide that lists out all the essential elements covered in the deck.
Slide 4: This is the Table of Content slide that lists out all the essential elements covered in the deck.
Slide 5: The slide provides a brief overview of the company’s operations (introduction, mission and vision statement) and financials (Revenue, EBIT, Net income and Non-Performing Assets)
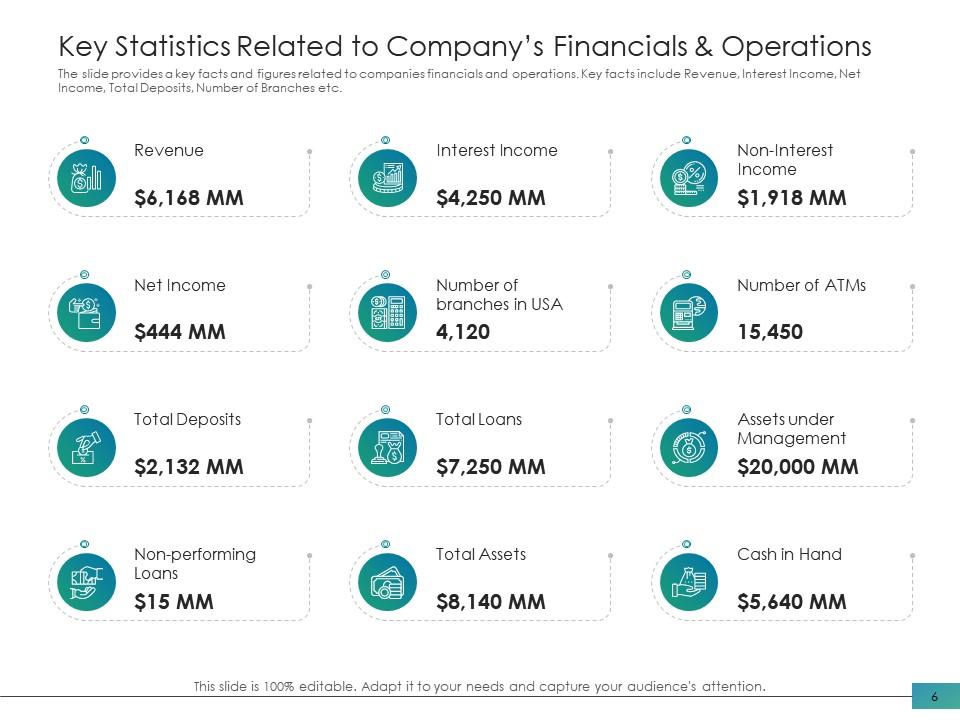
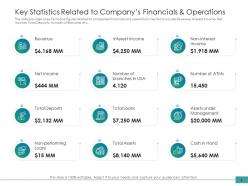
Slide 6: The slide provides a key facts and figures related to companies financials and operations. Key facts include Revenue, Interest Income, Net Income, Total Deposits, Number of Branches etc.
Slide 7: The slide explains the key problems faced by the customers and the solutions (for those problems) which the company offers through its products
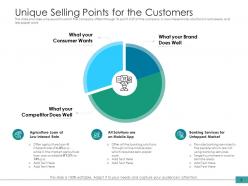
Slide 8: The slide provides unique points which the company offers through its point. USP of the company is: low interest rate, solutions in rural areas; and less paper work
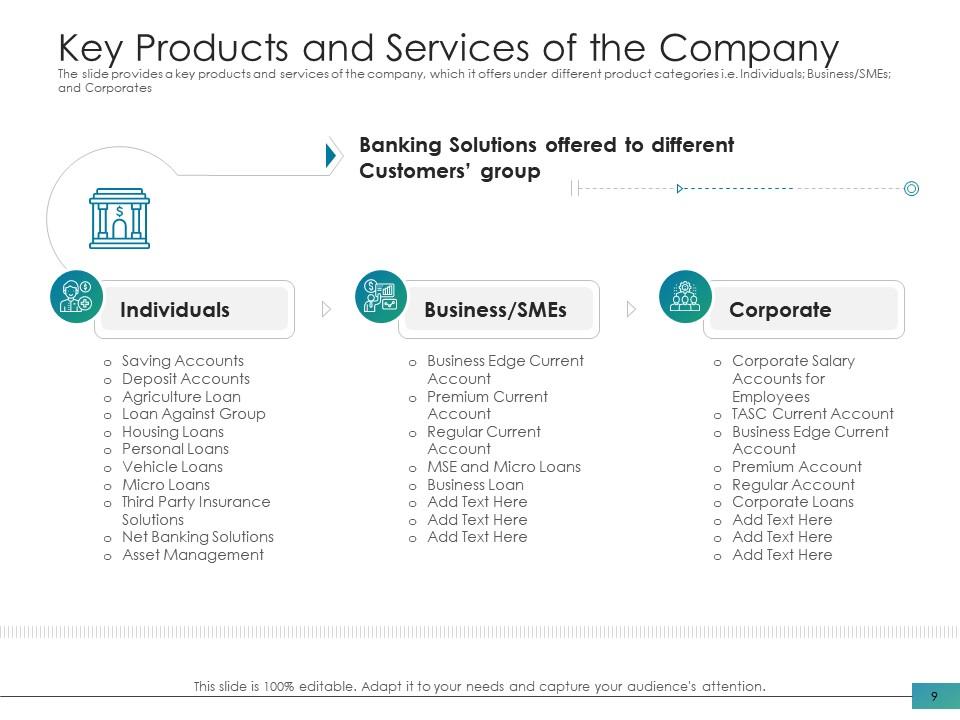
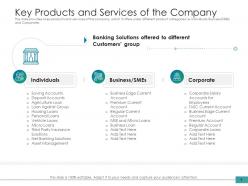
Slide 9: The slide provides a key products and services of the company, which it offers under different product categories i.e. Individuals; Business/SMEs; and Corporates
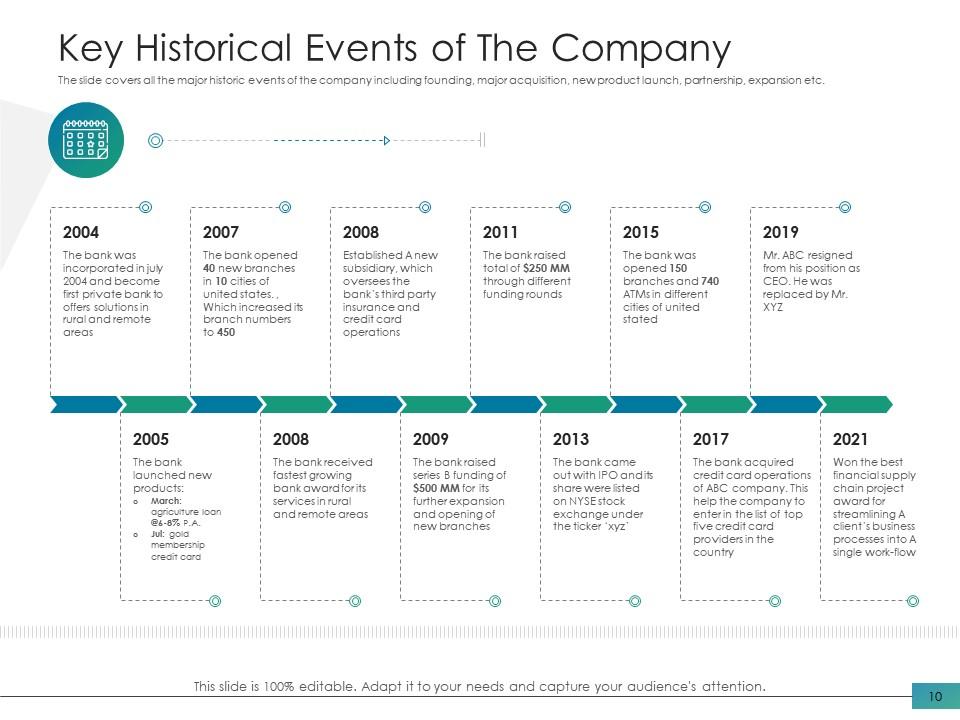
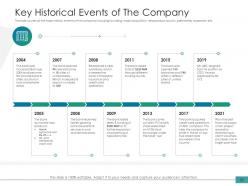
Slide 10: The slide covers all the major historic events of the company including founding, major acquisition, new product launch, partnership, expansion etc.
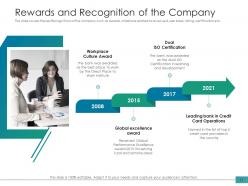
Slide 11: The slide covers the key Recognitions of the company such as awards, milestone related to revenue & user base, rating, certification etc.
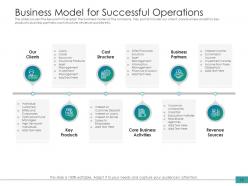
Slide 12: The slides covers the key points to explain the business model of the company. Key points include: our client. core business analytics; key products; business partners; cost structure, revenue sources etc.
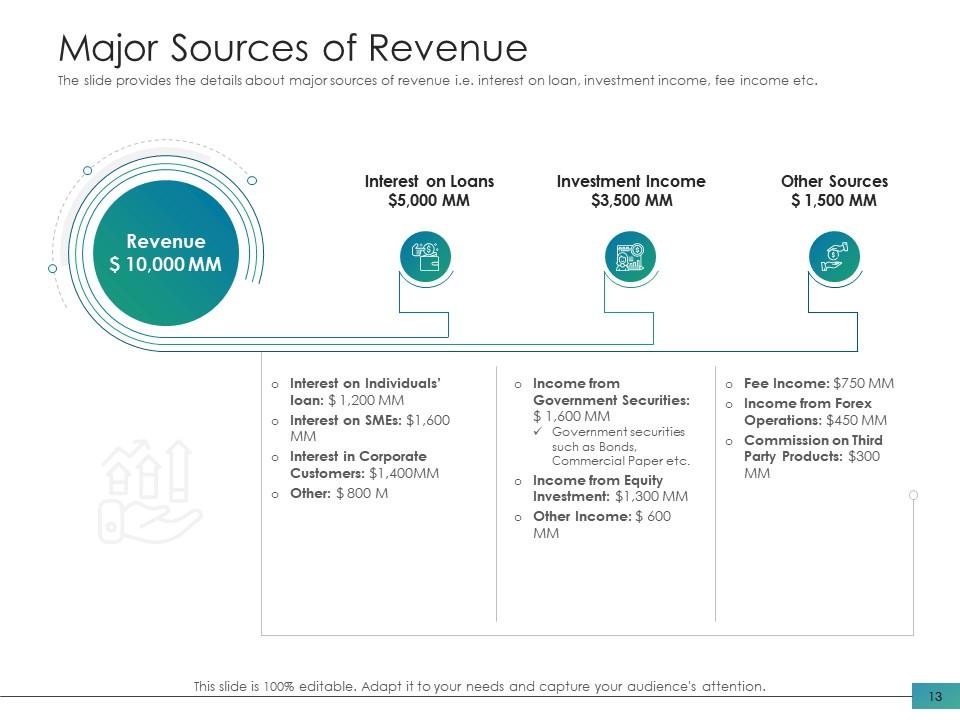
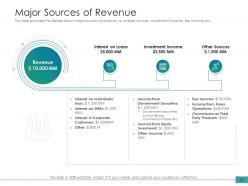
Slide 13: The slide provides the details about major sources of revenue i.e. interest on loan, investment income, fee income etc.
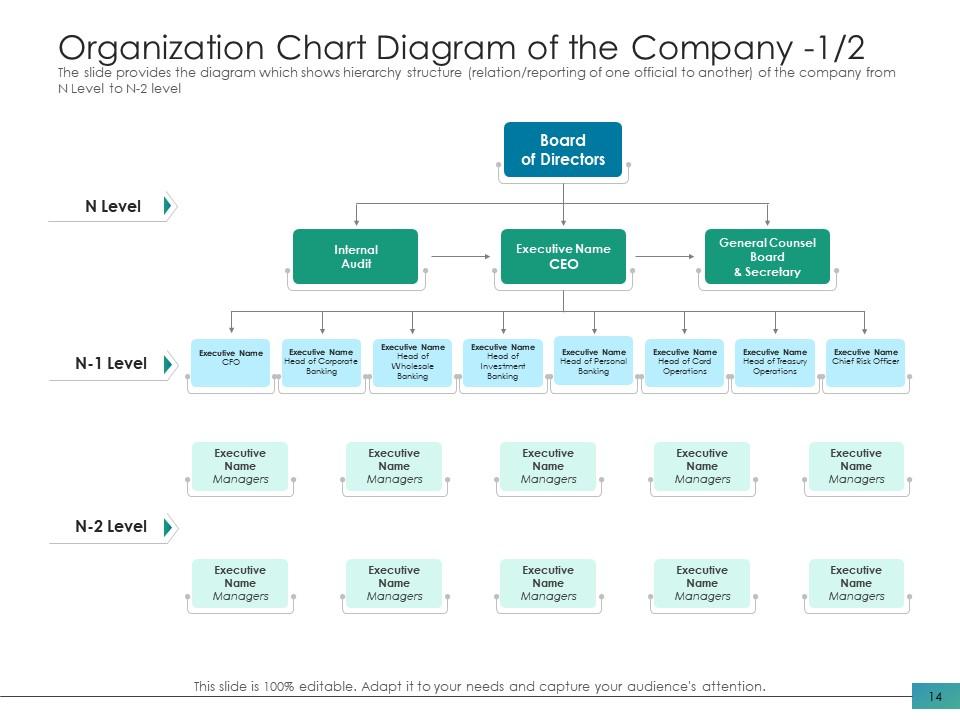
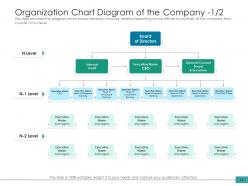
Slide 14: The slide provides the diagram which shows hierarchy structure (relation/reporting of one official to another) of the company from N Level to N-2 level
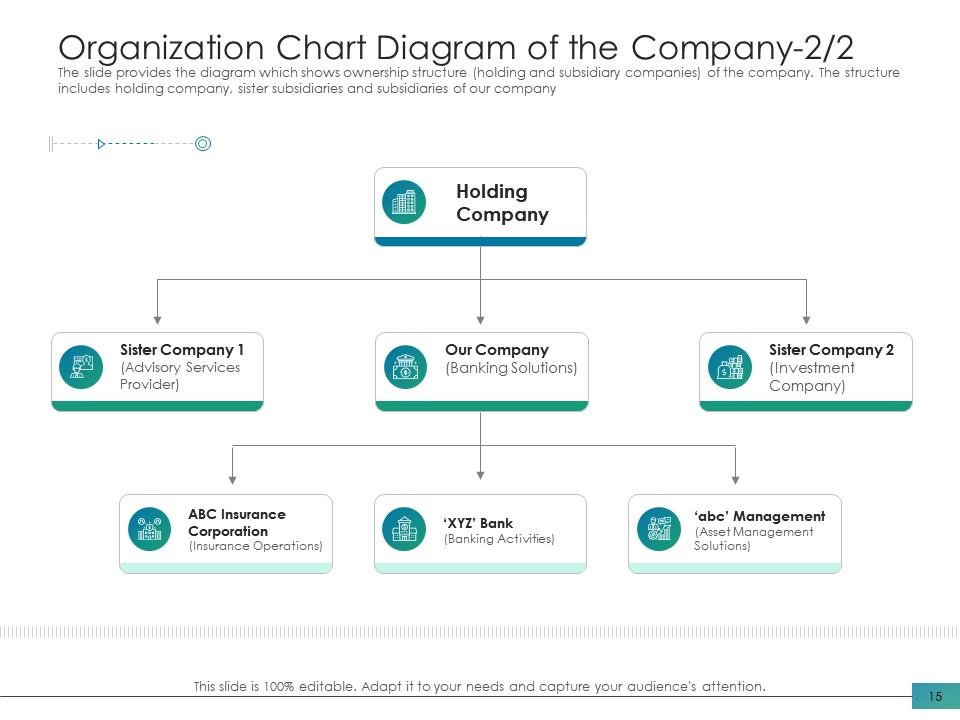
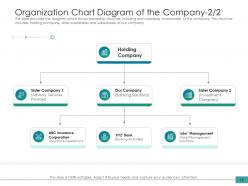
Slide 15: The slide provides the diagram which shows ownership structure (holding and subsidiary companies) of the company. The structure includes holding company, sister subsidiaries and subsidiaries of our company
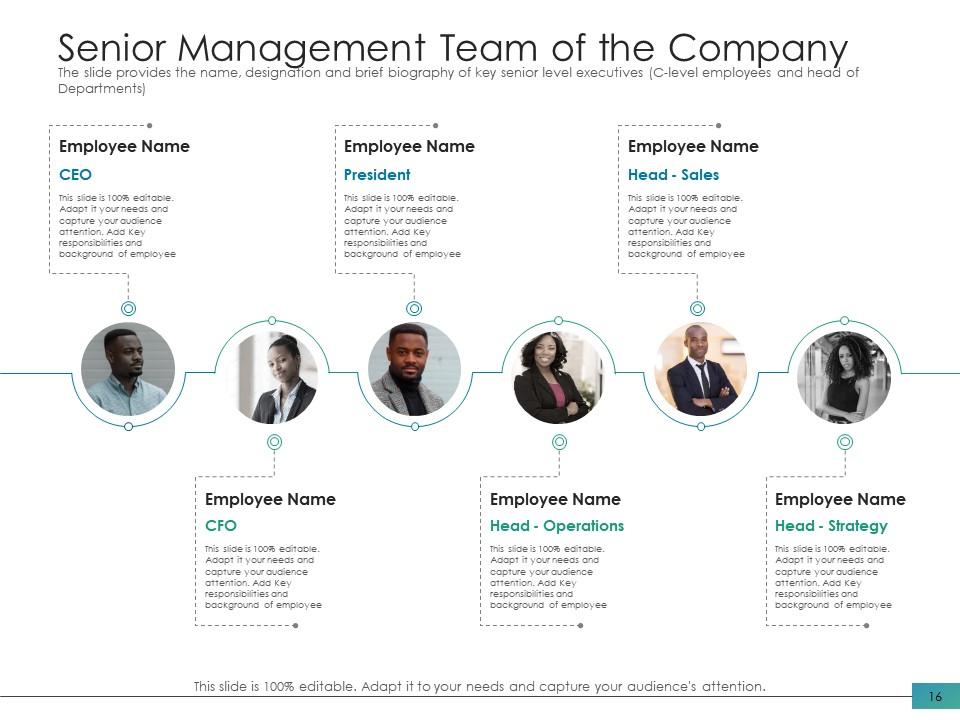
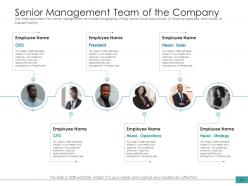
Slide 16: The slide provides the name, designation and brief biography of key senior level executives (C-level employees and head of Departments)
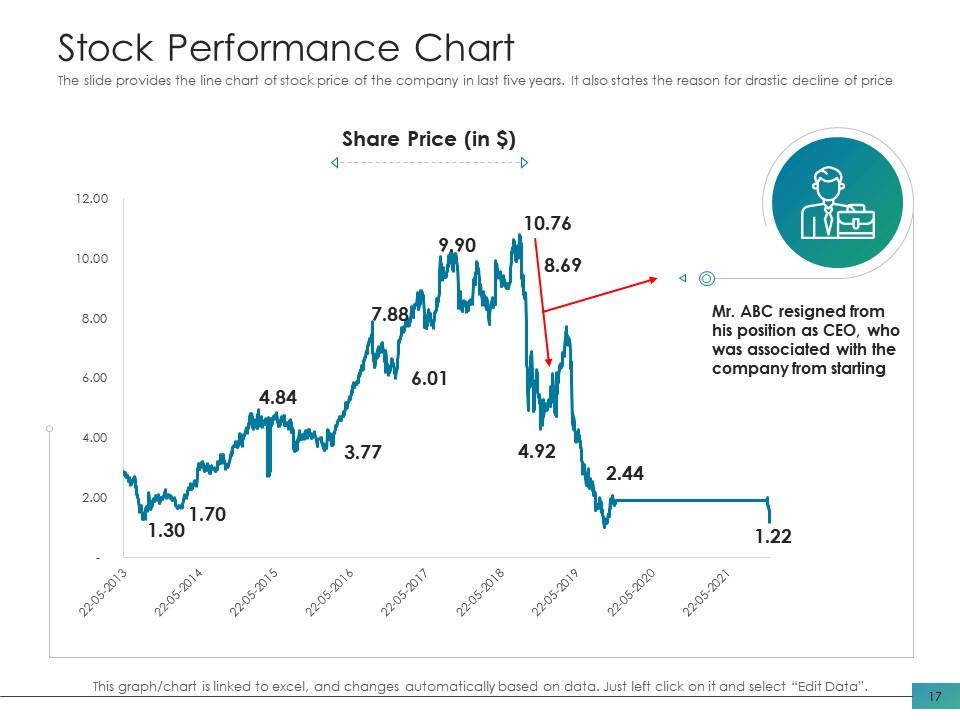
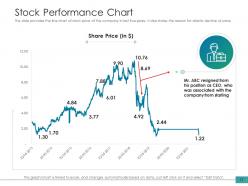
Slide 17: The slide provides the line chart of stock price of the company in last five years. It also states the reason for drastic decline of price
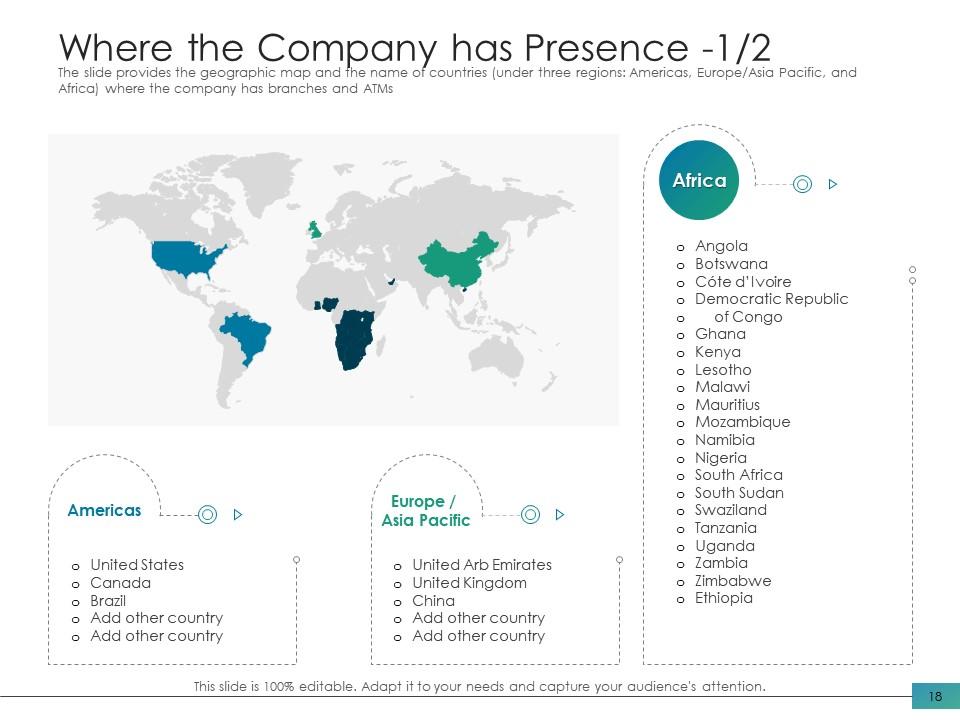
Slide 18: The slide provides the geographic map and the name of countries (under three regions: Americas, Europe/Asia Pacific, and Africa) where the company has branches and ATMs
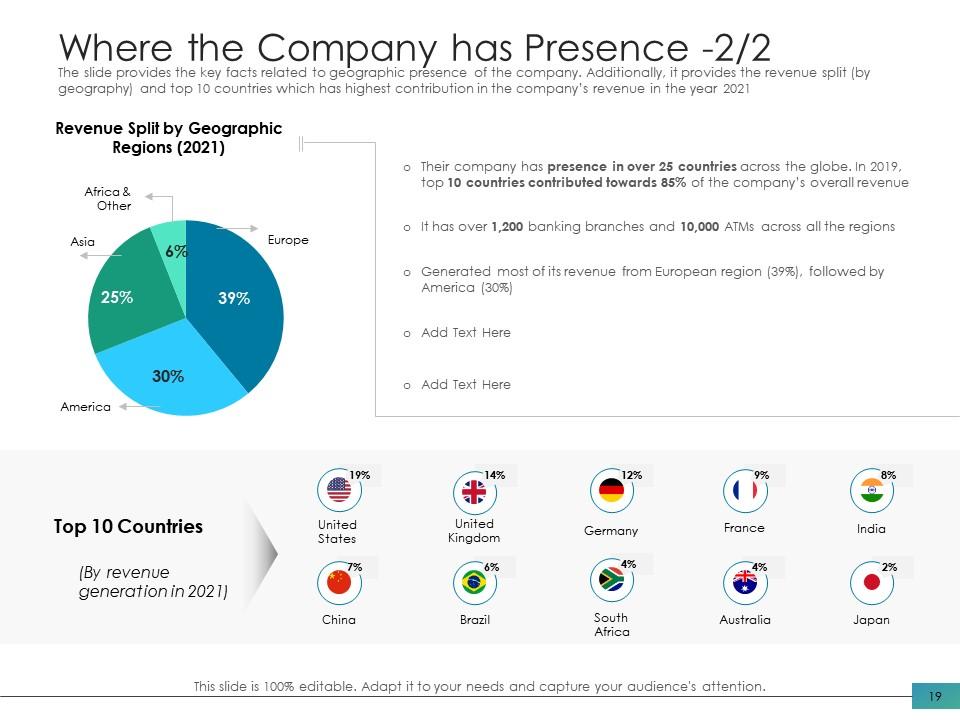
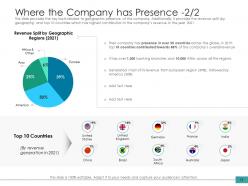
Slide 19: The slide provides the key facts related to geographic presence of the company. Additionally, it provides the revenue split (by geography) and top 10 countries which has highest contribution in the company’s revenue in the year 2021
Slide 20: The slide provides the key step/strategies which the company follows to strengthen its presence in new countries. Key strategies include: new branch opening, acquisition, and introducing new products
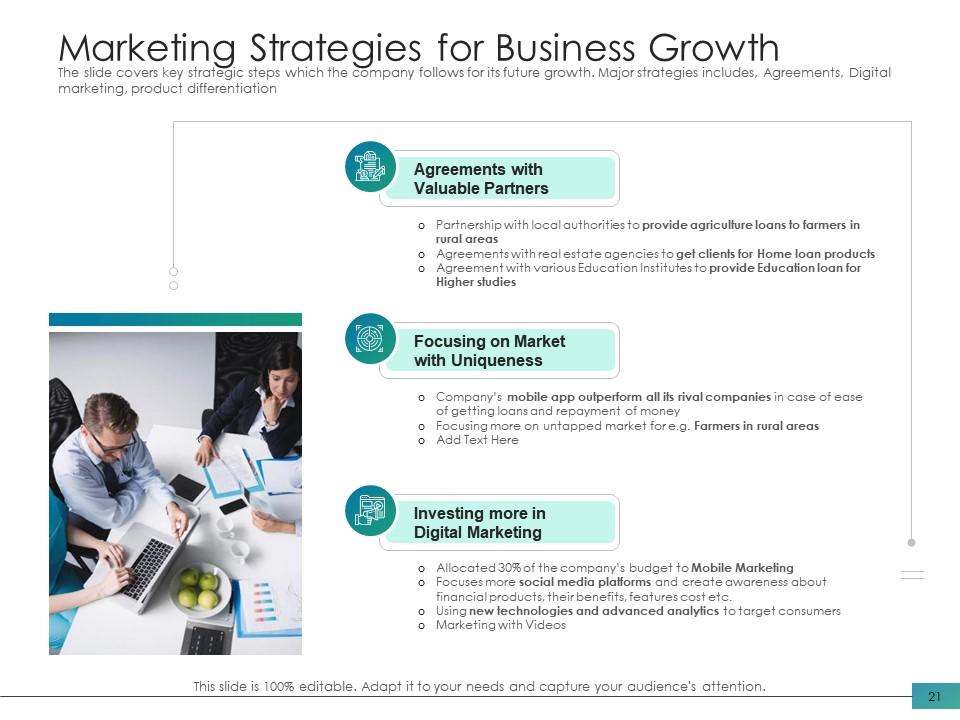
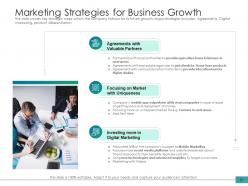
Slide 21: The slide covers key strategic steps which the company follows for its future growth. Major strategies includes, Agreements, Digital marketing, product differentiation
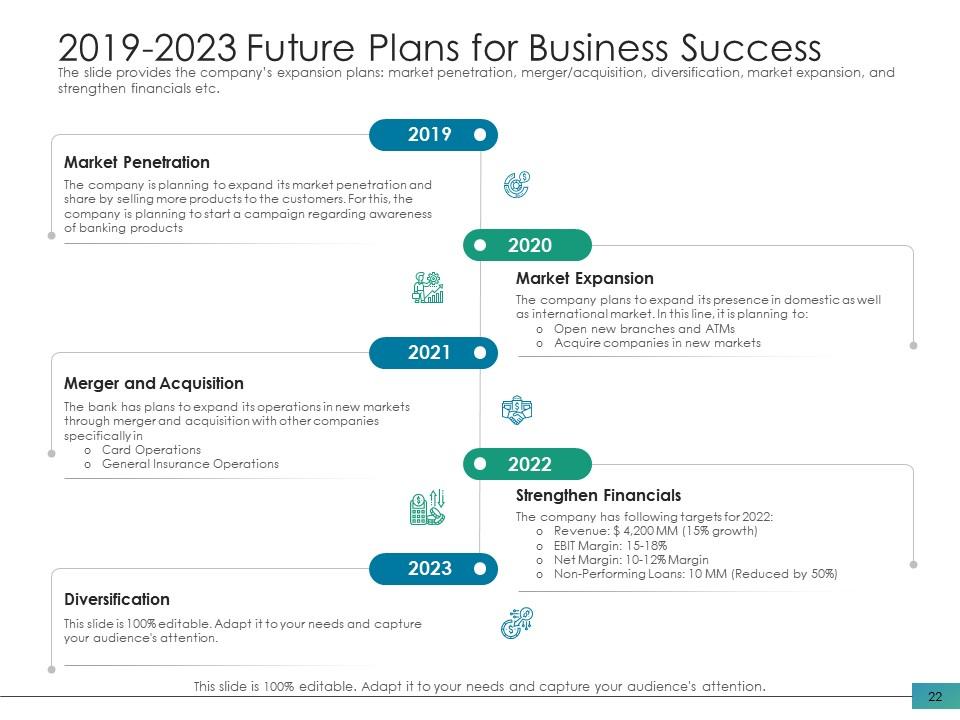
Slide 22: The slide provides the company’s expansion plans: market penetration, merger/acquisition, diversification, market expansion, and strengthen financials etc.
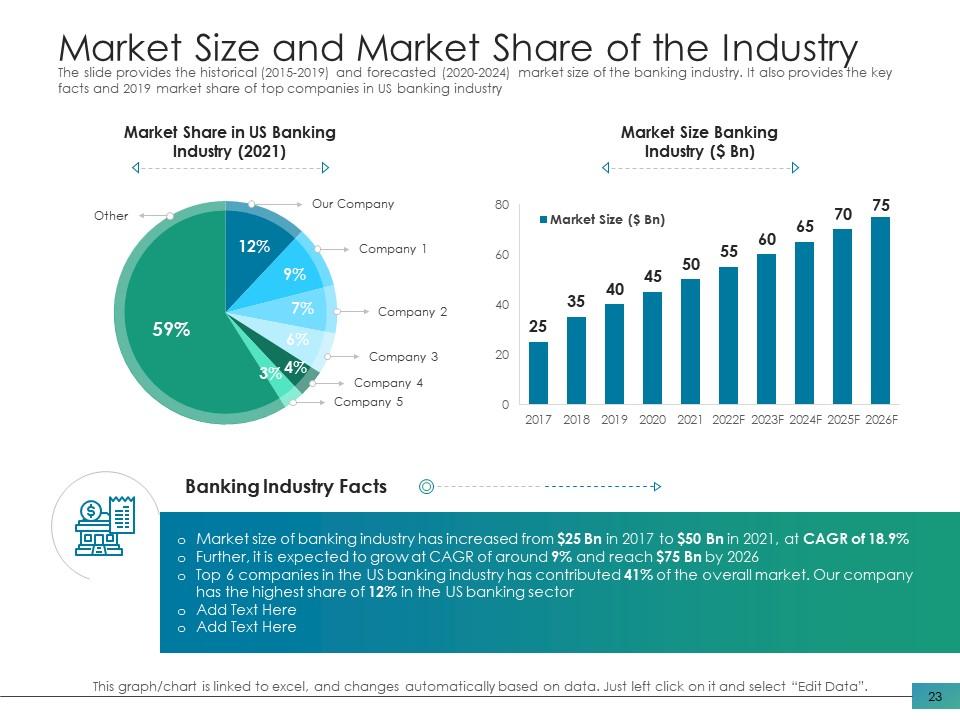
Slide 23: The slide provides the historical (2015-2019) and forecasted (2020-2024) market size of the banking industry. It also provides the key facts and 2019 market share of top companies in US banking industry
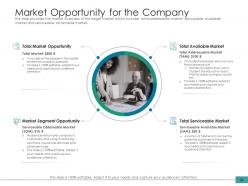
Slide 24: The slide provides the market overview of the target market which includes total addressable market, serviceable available market and serviceable obtainable market.
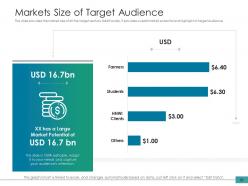
Slide 25: The slide provides the market size of all the target sectors. Additionally, it provides overall market potential and highlight of target audience
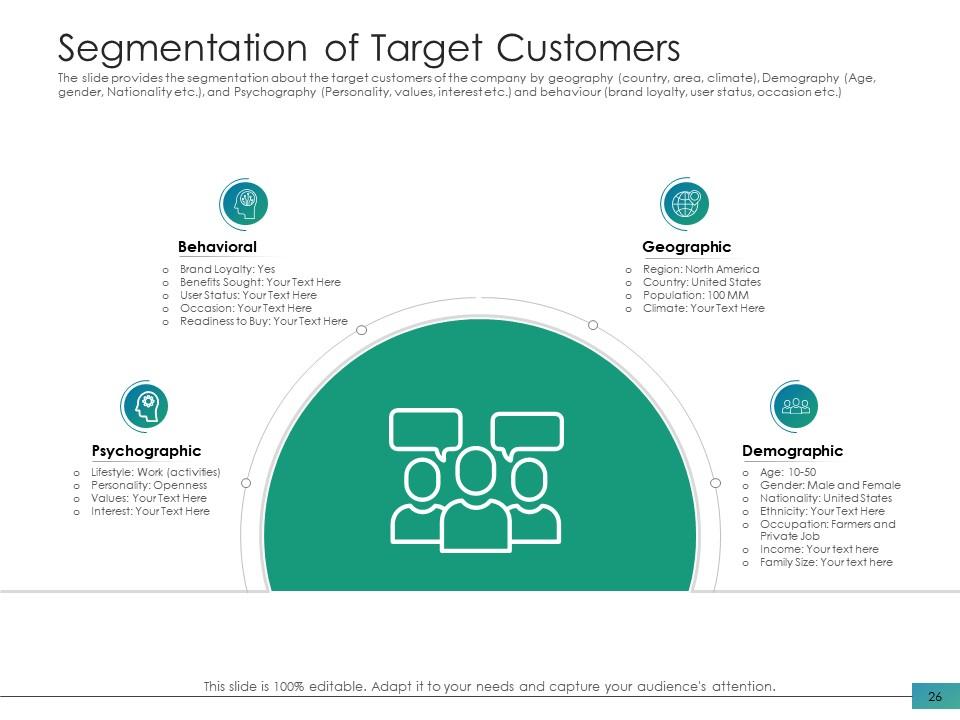
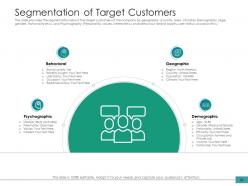
Slide 26: The slide provides the segmentation about the target customers of the company by geography (country, area, climate), Demography (Age, gender, Nationality etc.), and Psychography (Personality, values, interest etc.) and behaviour (brand loyalty, user status, occasion etc.)
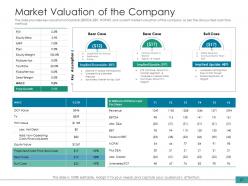
Slide 27: The slide provides key valuation ratios/stats (EBITDA, EBIT, NOPAT) and current market valuation of the company as per the discounted cash flow method
Slide 28: The slide provides the key ratios and a brief summary about the relevance of those ratios. Key ratios include: return on capital employed, earning per share, price-earning ratio, return on equity, dividend yield etc.
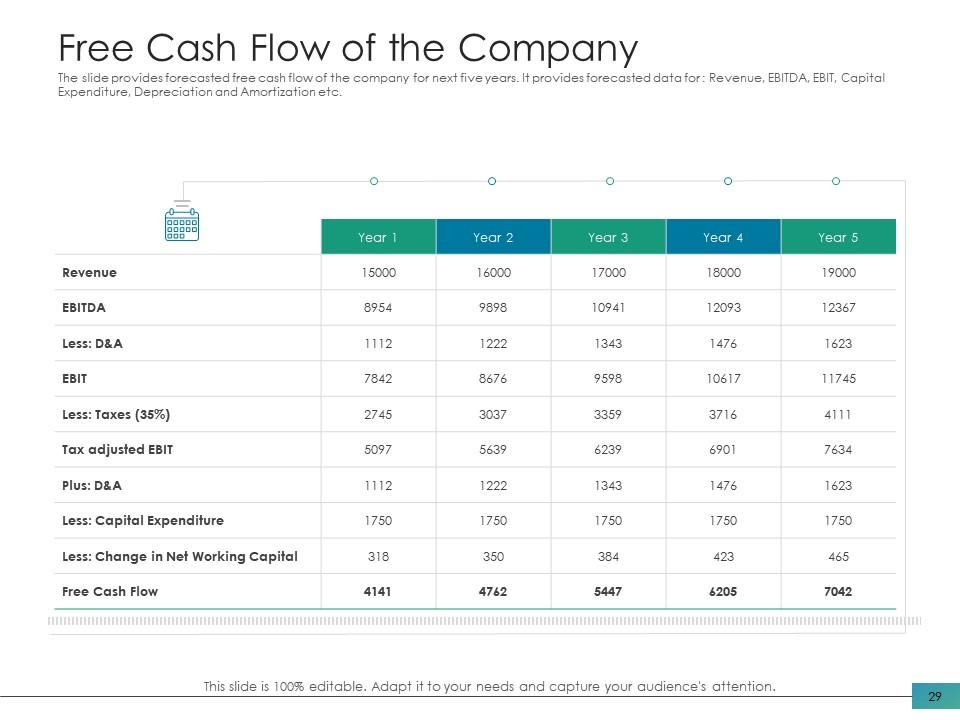
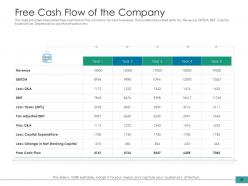
Slide 29: The slide provides forecasted free cash flow of the company for next five years. It provides forecasted data for : Revenue, EBITDA, EBIT, Capital Expenditure, Depreciation and Amortization etc.
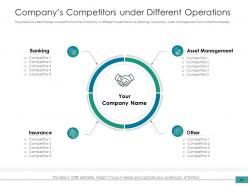
Slide 30: The slide provides the key competitors of the company in different operations i.e. banking, insurance, asset management and other businesses
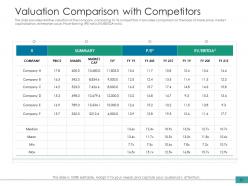
Slide 31: The slide provides relative valuation of the company comparing to its competitors. It provides comparison on the basis of share price, market capitalization, enterprise value, Price-Earning (PE) ratio; EV/EBITDA ratio.
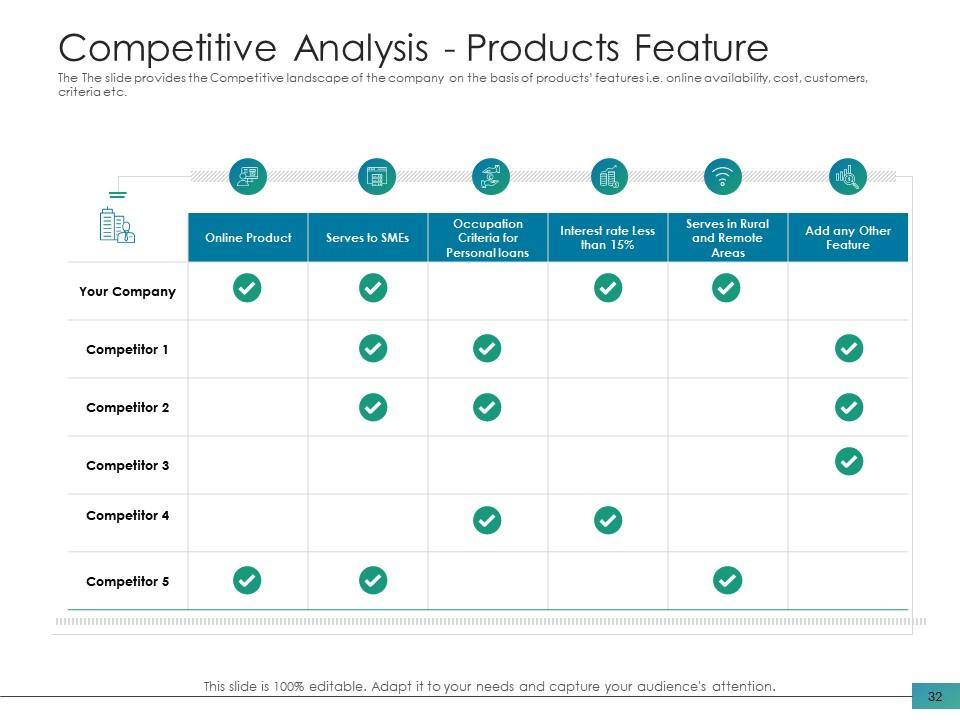
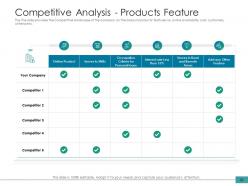
Slide 32: The The slide provides the Competitive landscape of the company on the basis of products’ features i.e. online availability, cost, customers, criteria etc.
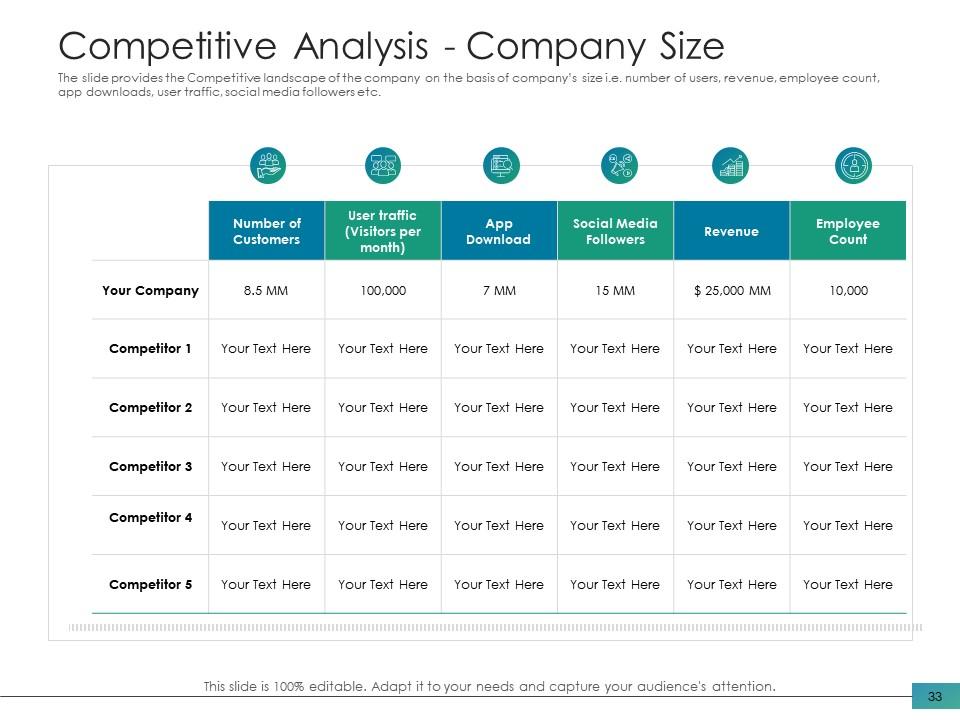
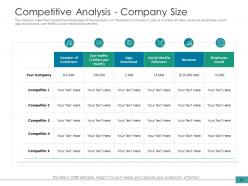
Slide 33: The slide provides the Competitive landscape of the company on the basis of company’s size i.e. number of users, revenue, employee count, app downloads, user traffic, social media followers etc.
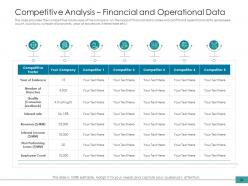
Slide 34: The slide provides the Competitive landscape of the company on the basis of financial data (sales and profit) and operational data (employee count, locations, number of branches, year of existence, interest rate etc.)
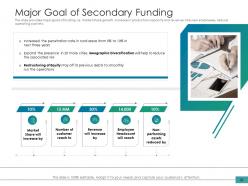
Slide 35: The slide provides major goals of funding i.e. market share growth, increase in production capacity and revenue, hire new employees, reduce operating cost etc.
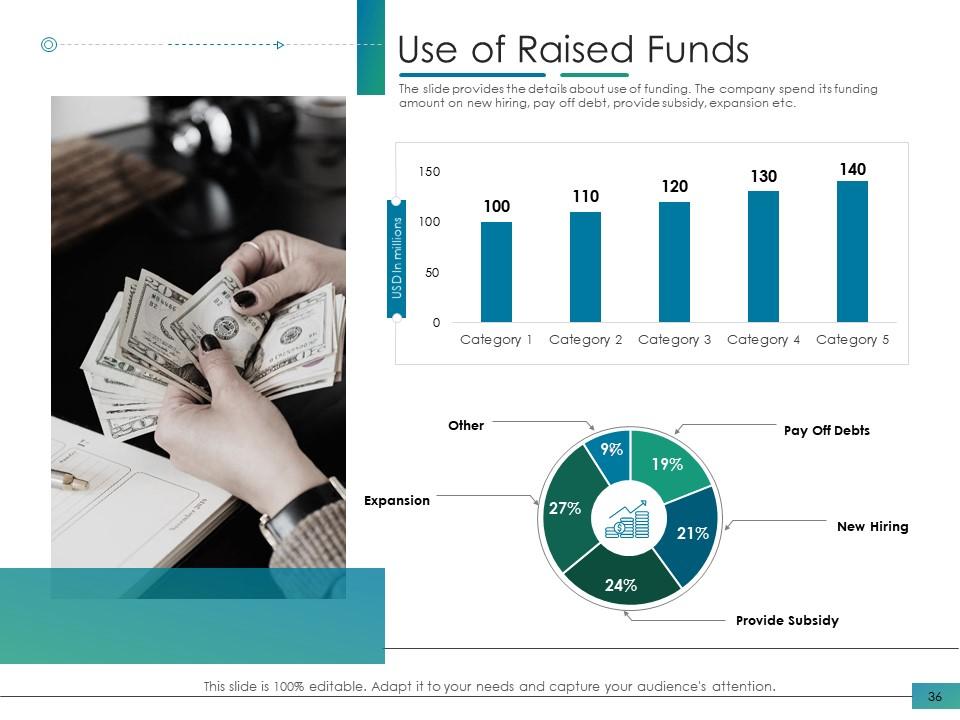
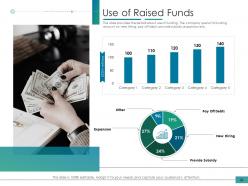
Slide 36: The slide provides the details about use of funding. The company spend its funding amount on new hiring, pay off debt, provide subsidy, expansion etc.
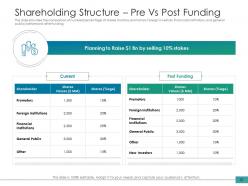
Slide 37: The slide provides the comparison of number/percentage of shares (hold by promotors, Foreign investors, Financials institutions, and general public) before and after funding
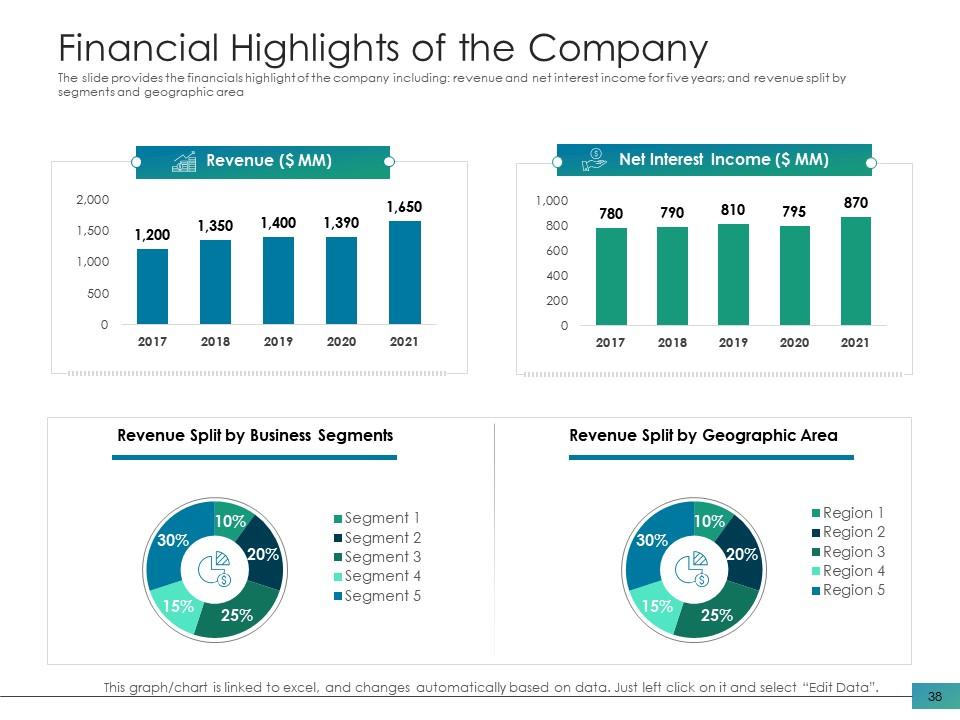
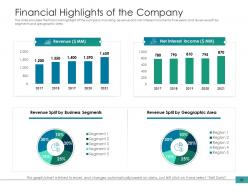
Slide 38: The slide provides the financials highlight of the company including: revenue and net interest income for five years; and revenue split by segments and geographic area
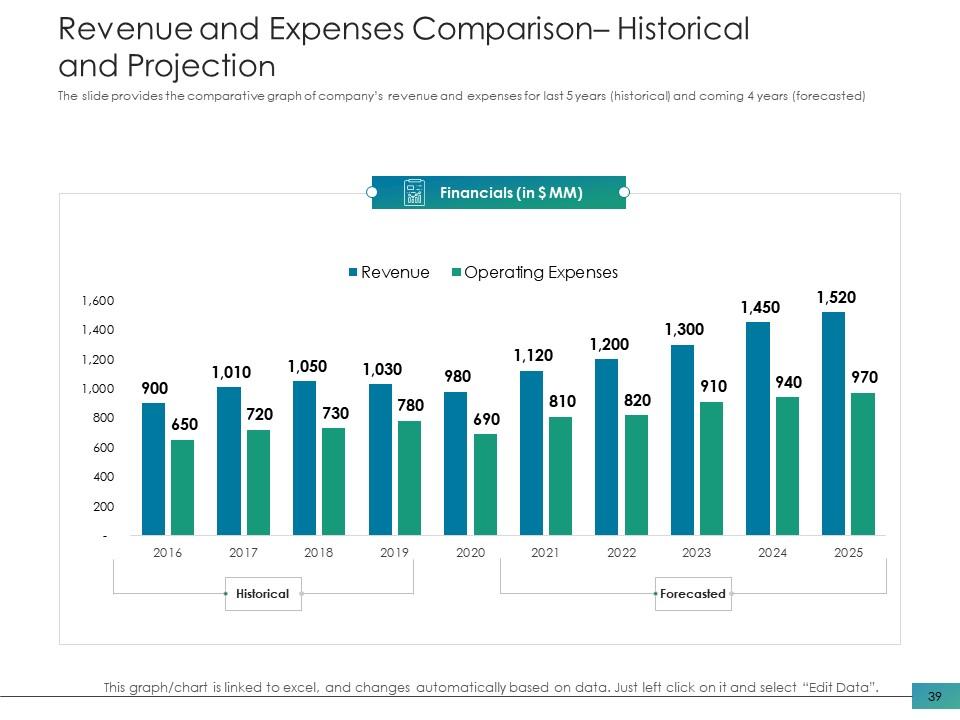
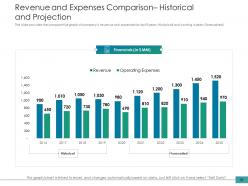
Slide 39: The slide provides the comparative graph of company’s revenue and expenses for last 5 years (historical) and coming 4 years (forecasted)
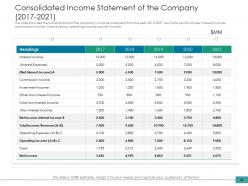
Slide 40: The slide provides the historical data of the company’s income statement from the year 2015-2021. Key Data points include: interest income, commission income, total revenue, operating income and net income
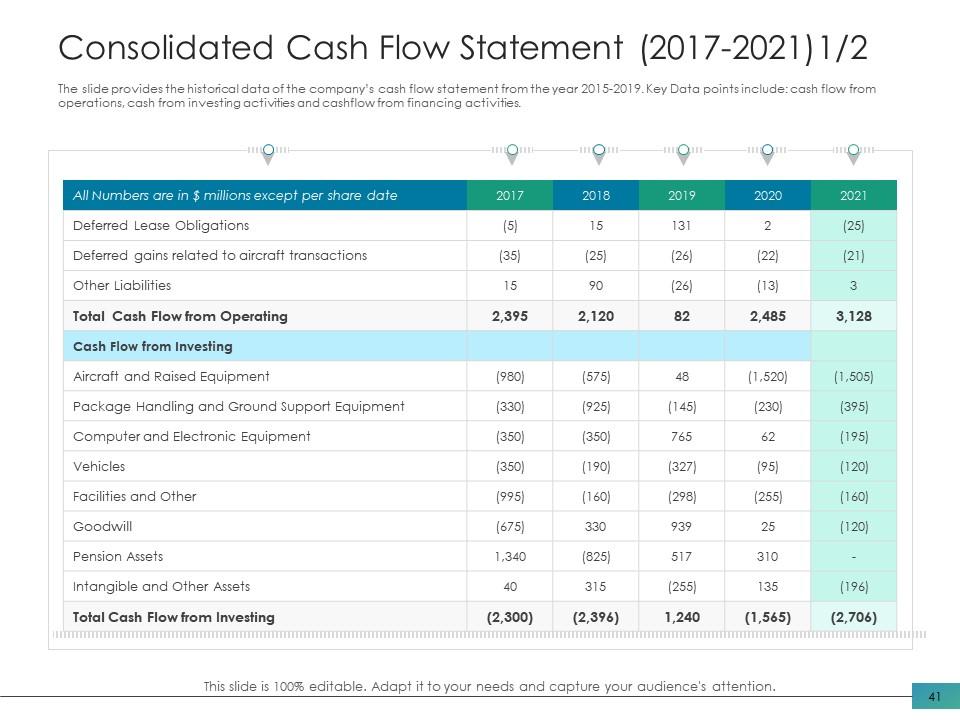
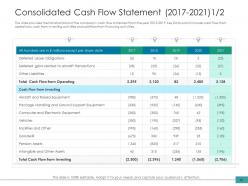
Slide 41: The slide provides the historical data of the company’s cash flow statement from the year 2015-2019. Key Data points include: cash flow from operations, cash from investing activities and cashflow from financing activities.
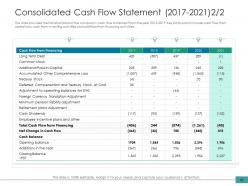
Slide 42: The slide provides the historical data of the company’s cash flow statement from the year 2015-2019. Key Data points include: cash flow from operations, cash from investing activities and cashflow from financing activities.
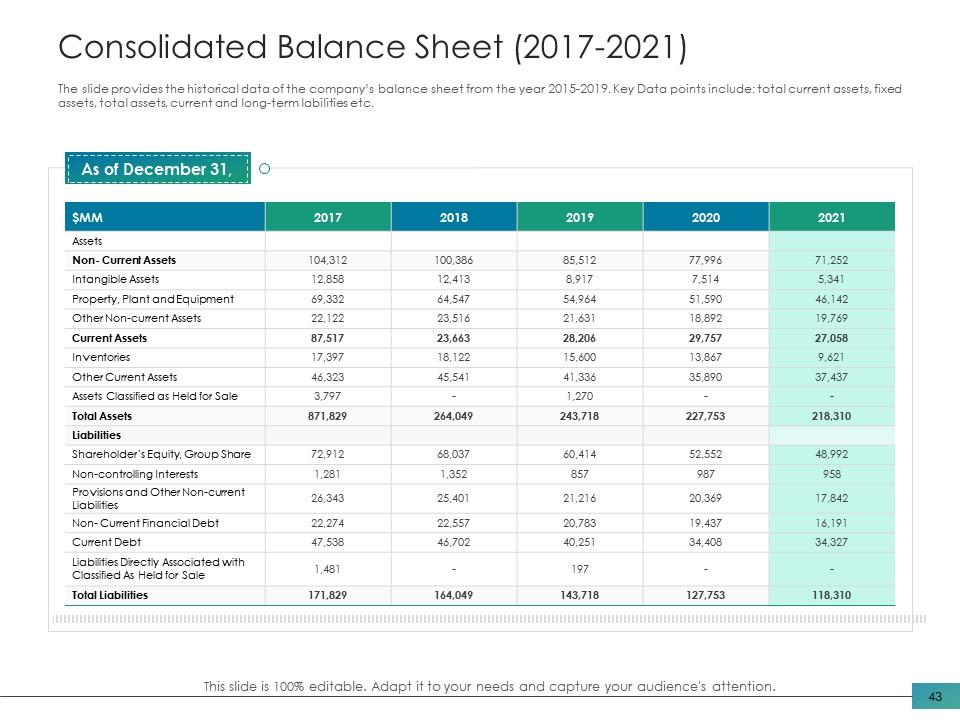
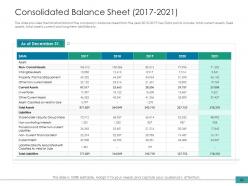
Slide 43: The slide provides the historical data of the company’s balance sheet from the year 2015-2019. Key Data points include: total current assets, fixed assets, total assets, current and long-term labilities etc.
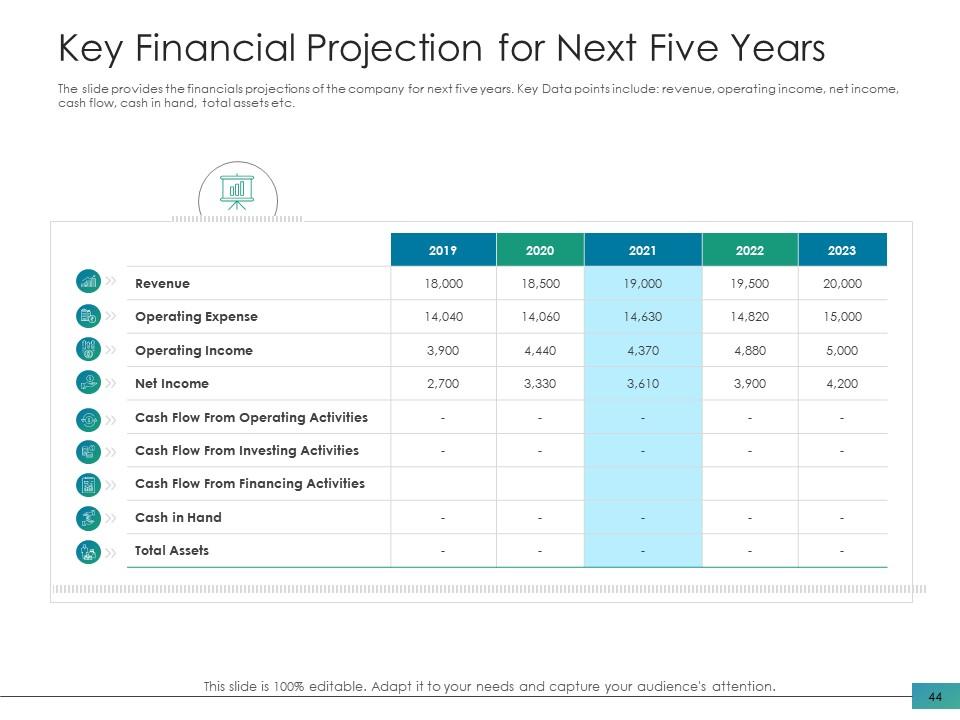
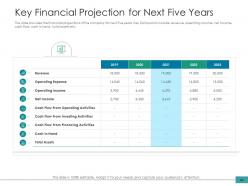
Slide 44: The slide provides the financials projections of the company for next five years. Key Data points include: revenue, operating income, net income, cash flow, cash in hand, total assets etc.
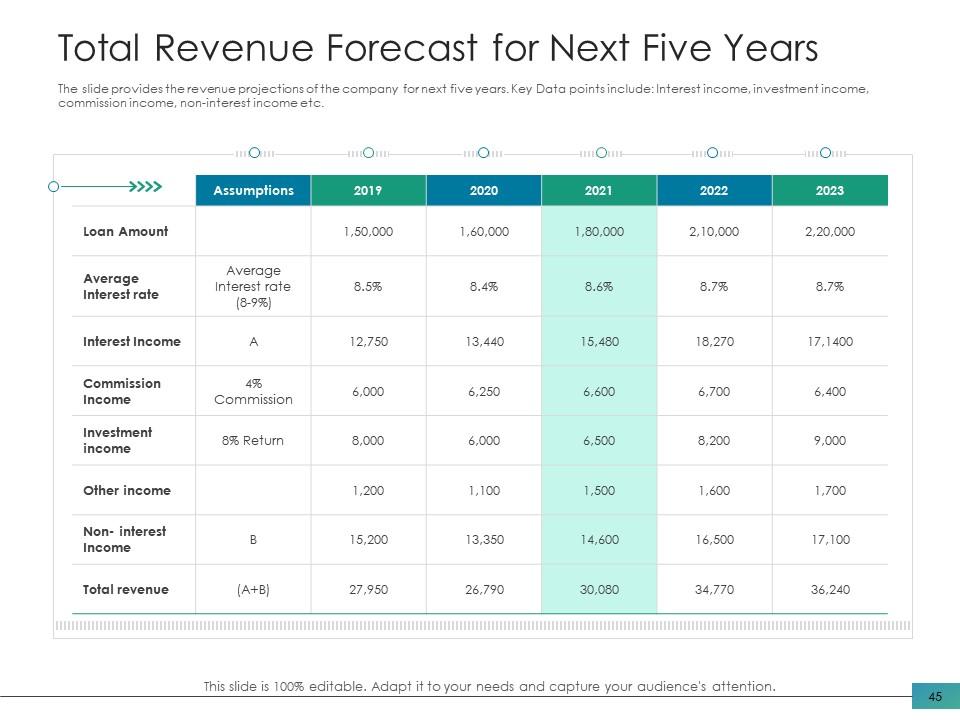
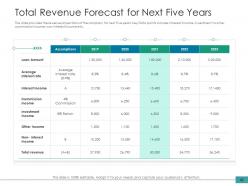
Slide 45: The slide provides the revenue projections of the company for next five years. Key Data points include: Interest income, investment income, commission income, non-interest income etc.
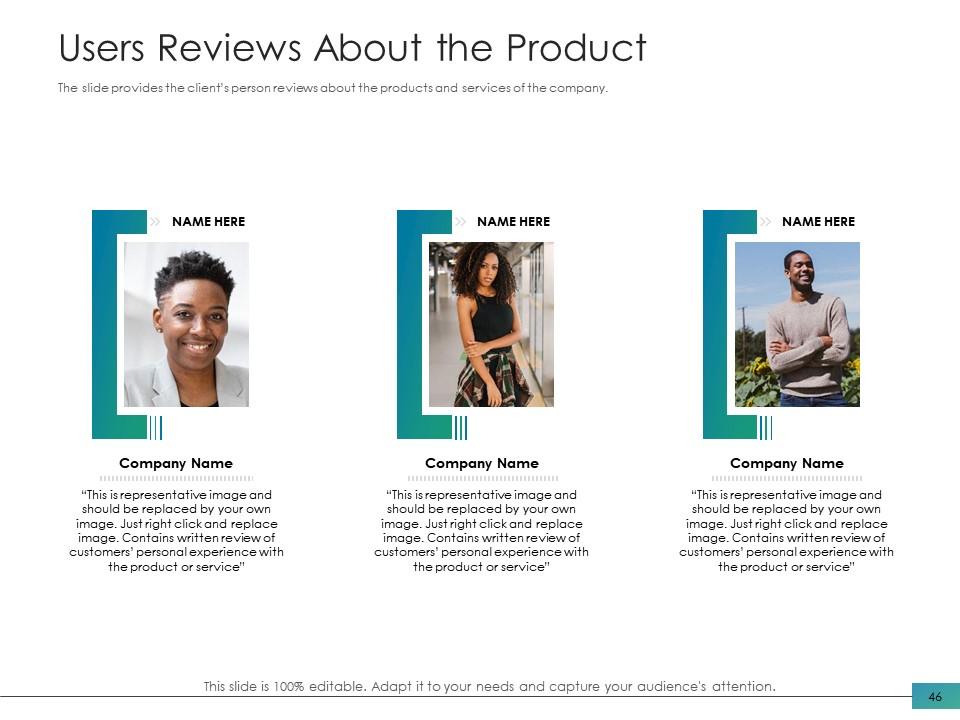
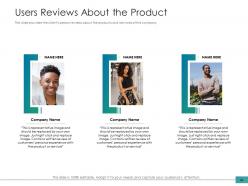
Slide 46: The slide provides the client’s person reviews about the products and services of the company.
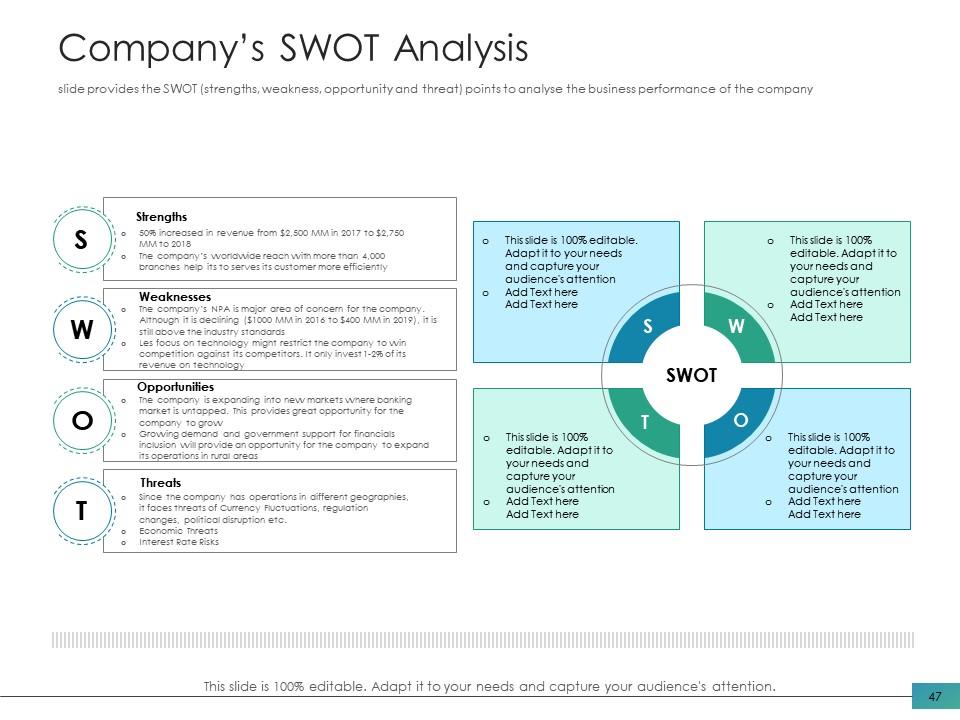
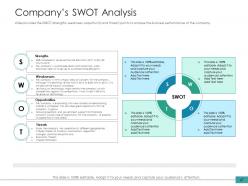
Slide 47: This slide provides the SWOT (strengths, weakness, opportunity and threat) points to analyse the business performance of the company
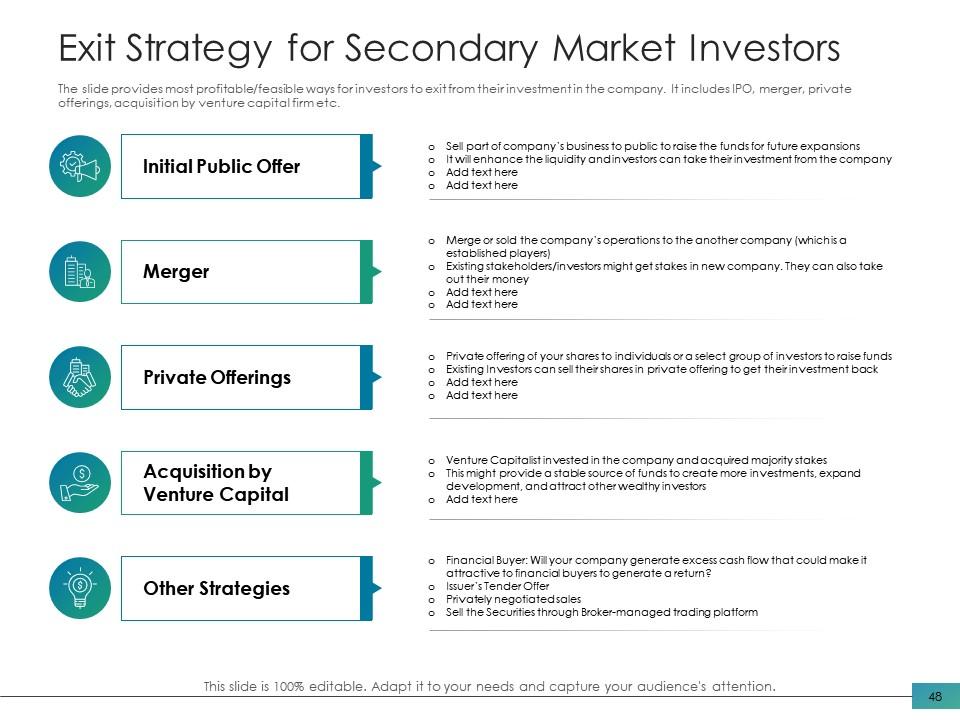
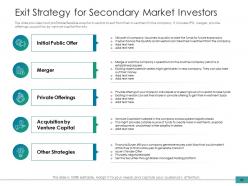
Slide 48: The slide provides most profitable/feasible ways for investors to exit from their investment in the company. It includes IPO, merger, private offerings, acquisition by venture capital firm etc.
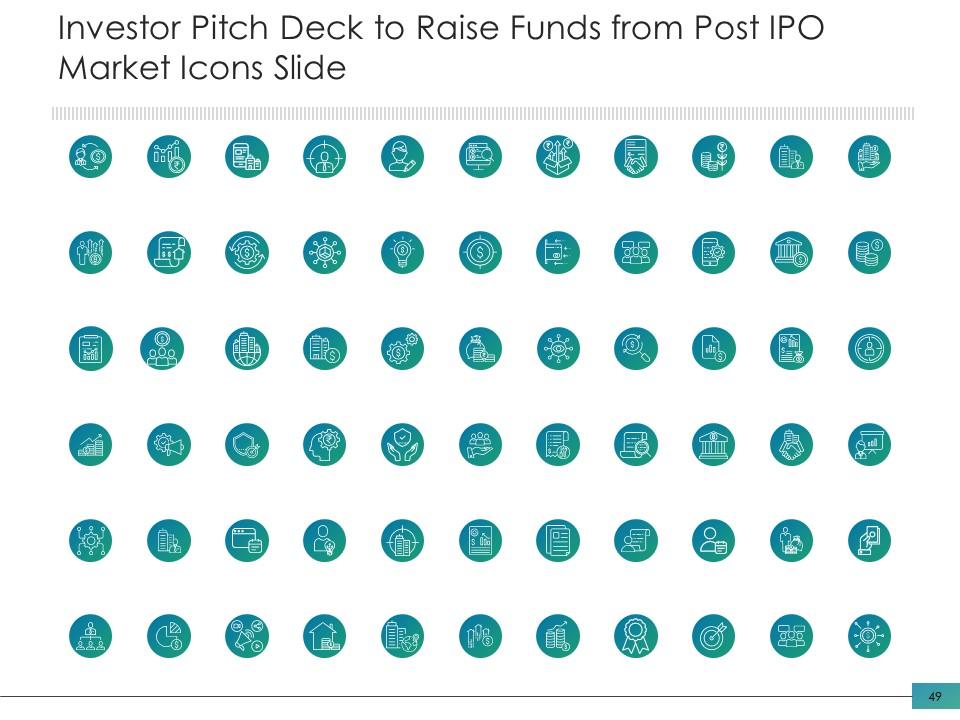
Slide 49: This is Icon Slide with various icons. Use as per need and requirement.
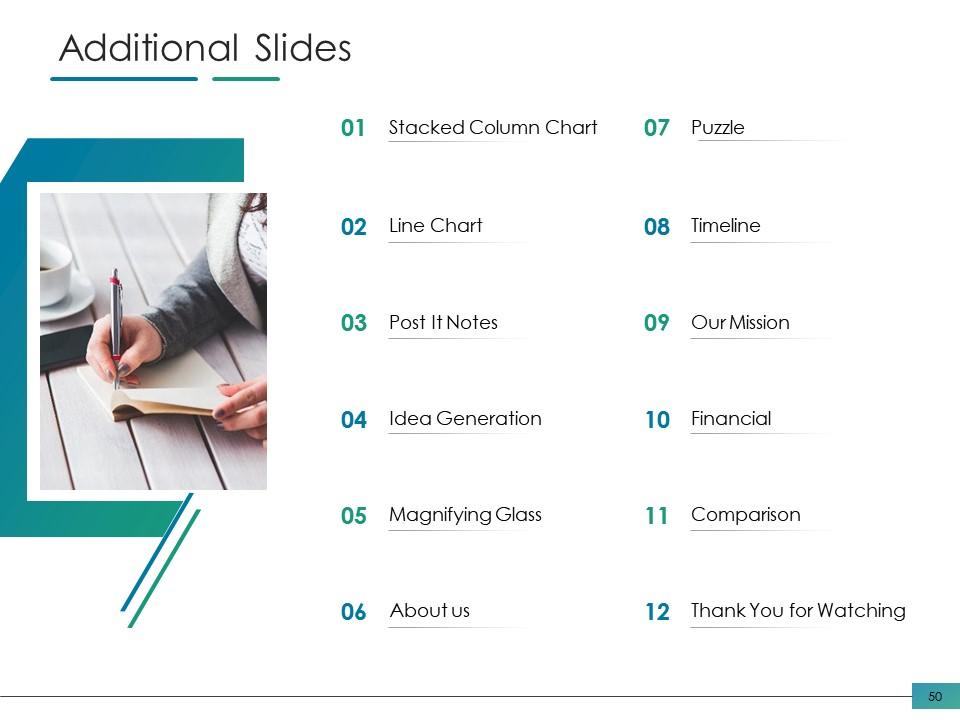
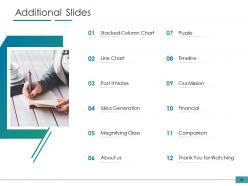
Slide 50: This slide is titled Additional Slides to move forward. Change/ alter content as per need.
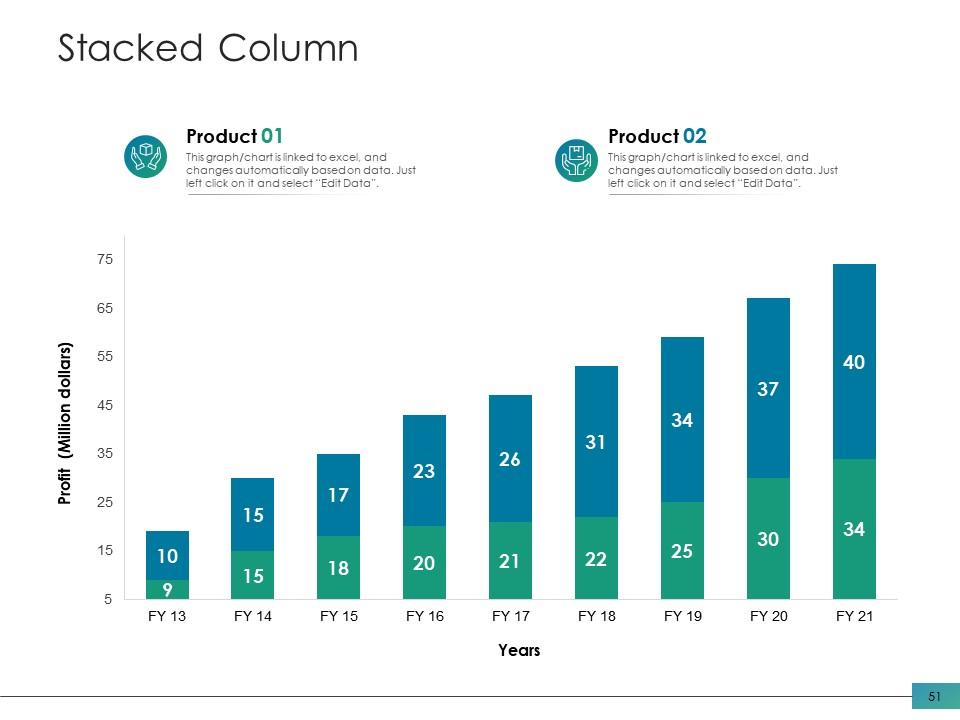
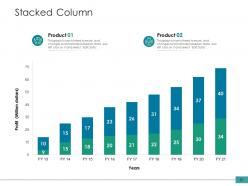
Slide 51: This is a Stacked Column chart slide that can be used to compare different products.
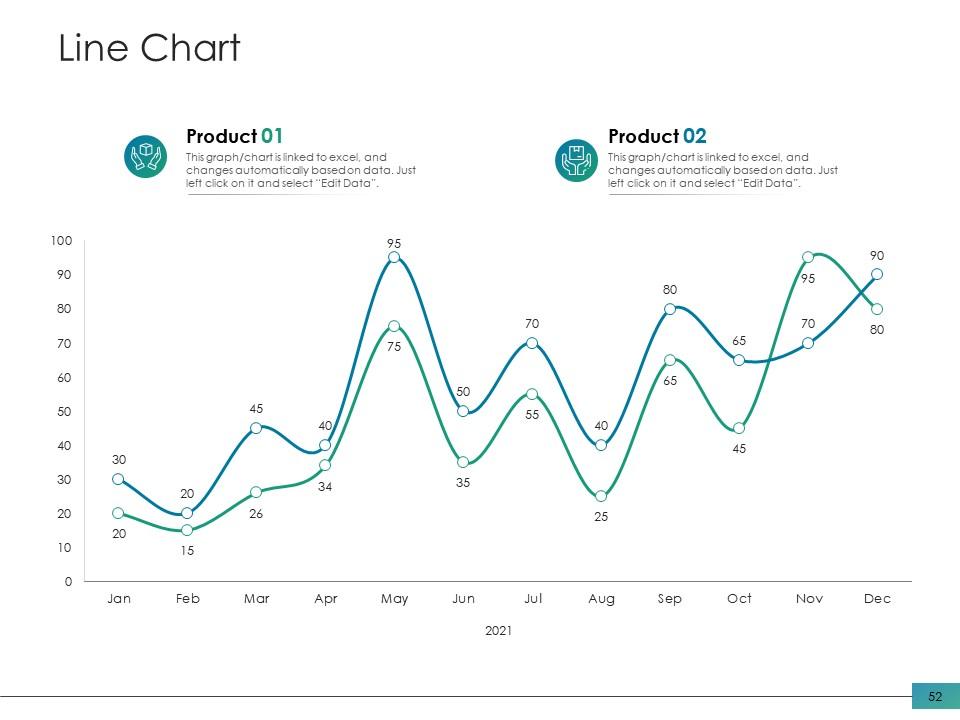
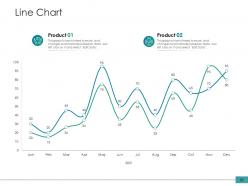
Slide 52: This is a Line Chart slide that can be used to compare two different products.
Slide 53: This is a Post IT Notes slide that can be used to keep important information at one place.
Slide 54: This is a Idea Generation image slide to present innovative/ creative aspects
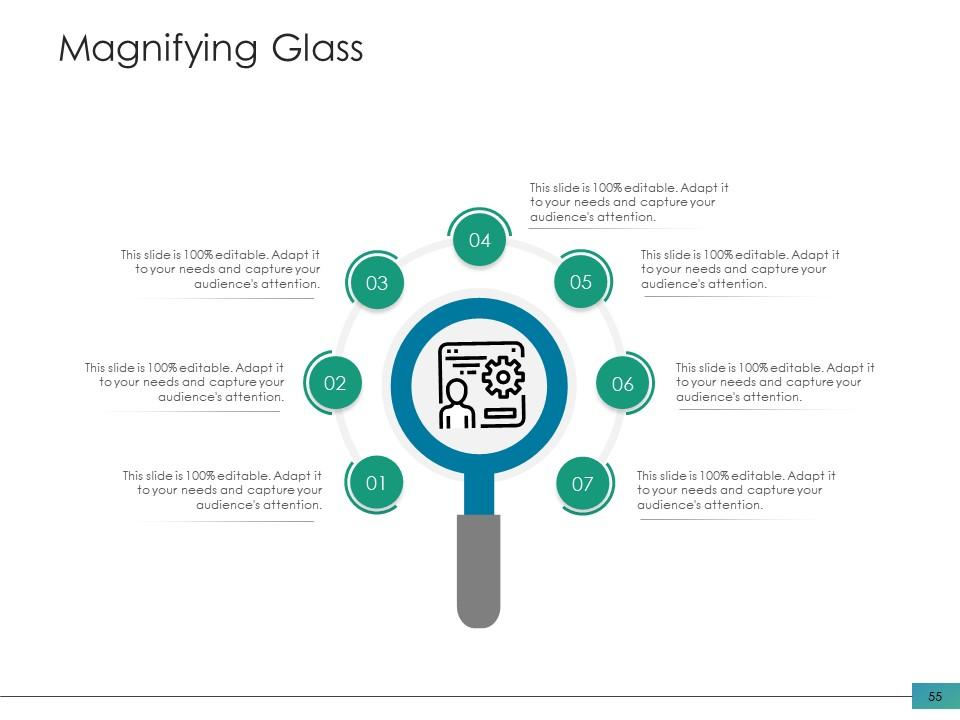
Slide 55: This is a Magnifying Glass slide that can be used to highlight important information.
Slide 56: This is an About Us slide. State company/team specifications etc. here.
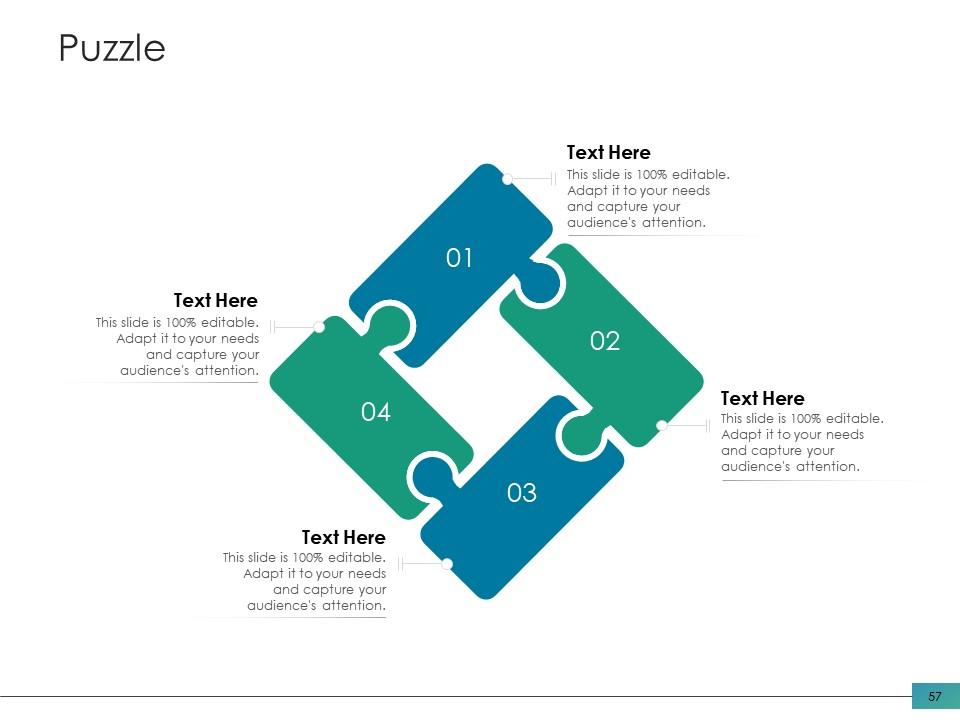
Slide 57: This is a creative Puzzle image slide to state information, specifications etc.
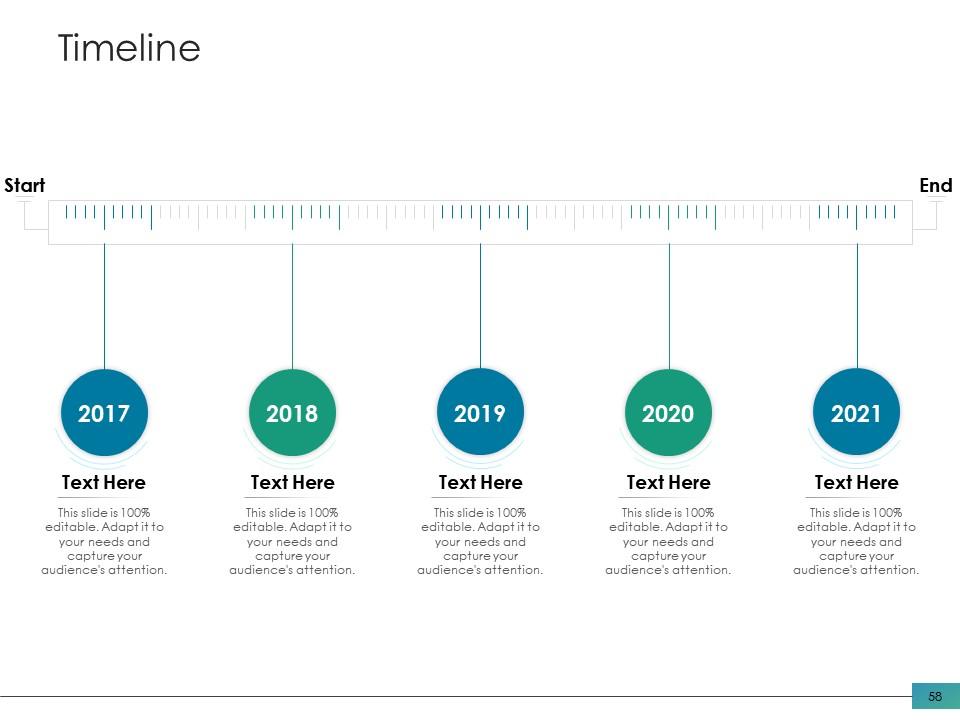
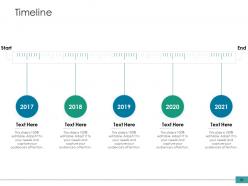
Slide 58: This is a Timeline slide that can be used to present series of events.
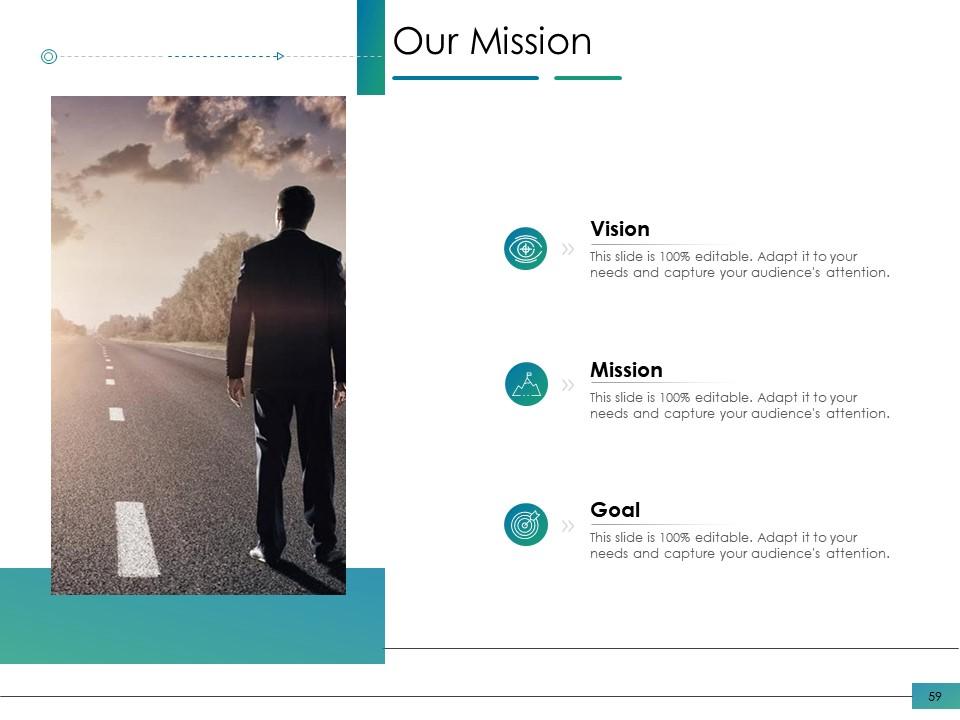
Slide 59: This is Our Mission Our Vision slide to state your mission, vision etc.
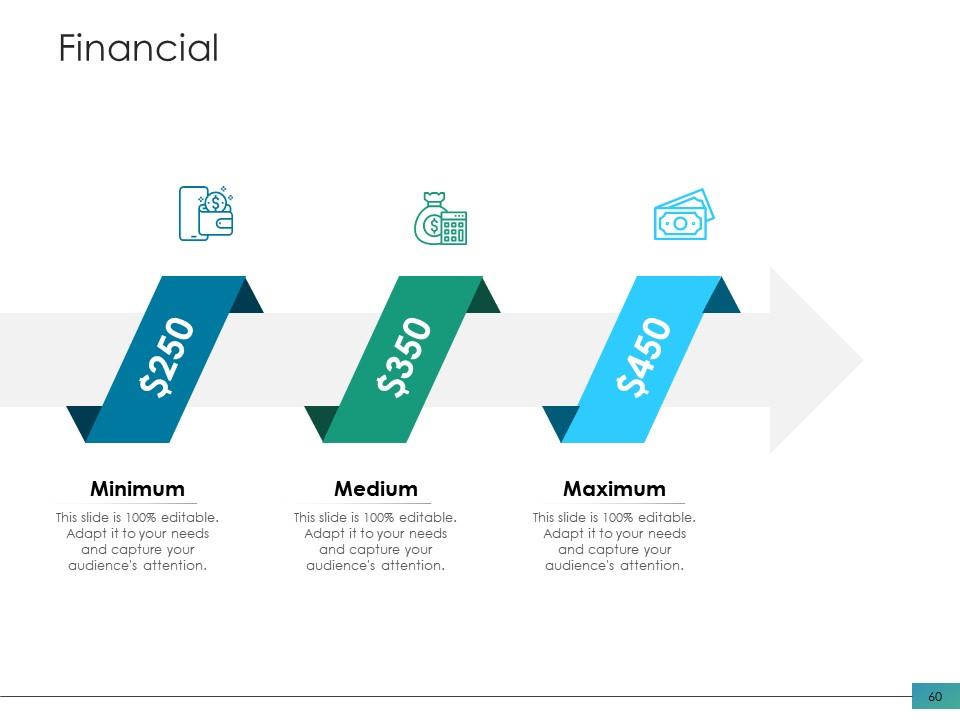
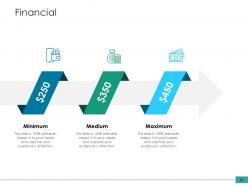
Slide 60: This is Financial scores slide. State your financial aspects etc. here.
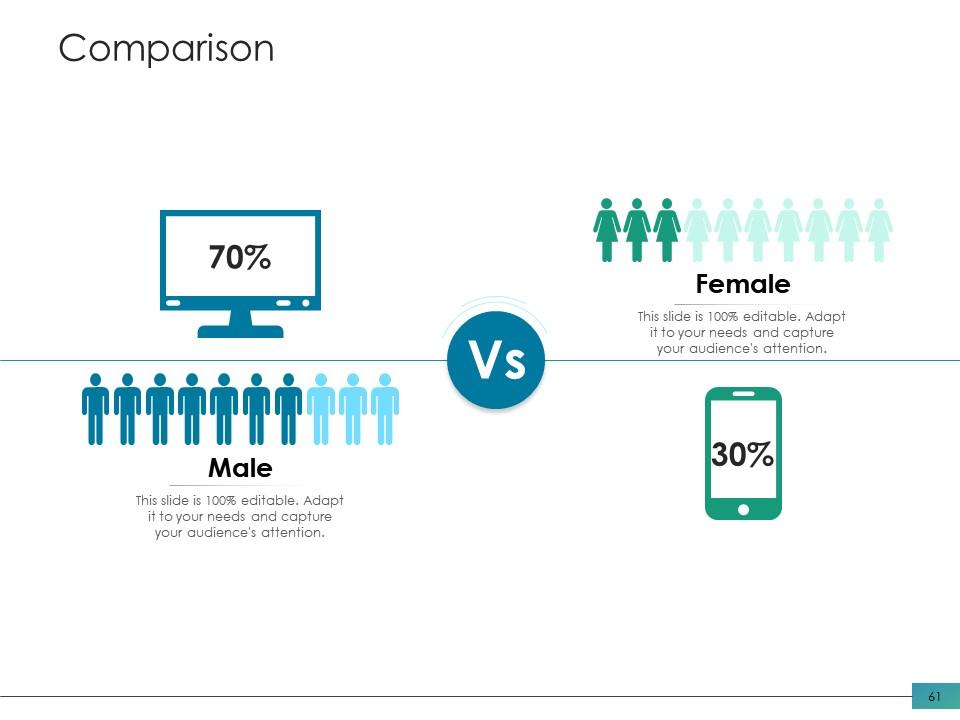
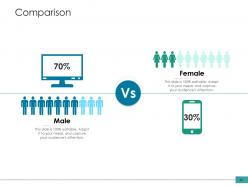
Slide 61: This is Comparison slide to compare two products/ entities etc.
Slide 62: This is a Thank You slide for acknowledgement.
Investor pitch deck to raise funds from post ipo market powerpoint presentation slides with all 62 slides:
Use our Investor Pitch Deck To Raise Funds From Post IPO Market Powerpoint Presentation Slides to effectively help you save your valuable time. They are readymade to fit into any presentation structure.
-
Awesome use of colors and designs in product templates.
-
Easy to edit slides with easy to understand instructions.
-
The Designed Graphic are very professional and classic.
-
Perfect template with attractive color combination.
-
Great designs, Easily Editable.
-
Nice and innovative design.
-
Commendable slides with attractive designs. Extremely pleased with the fact that they are easy to modify. Great work!
-
Great quality slides in rapid time.
-
Great experience, I would definitely use your services further.
