Investor pitch presentation to raise funds from financial market complete deck
Introducing our investor pitch presentation to raise funds from financial market complete PPT deck. Motivate investors to provide funding for the growth of your efficient company with the help of our promotion assistance PowerPoint deck. This pitch elevation PPT theme gives the operational and financial overview of the company. This ready-made corporate pitch deck PowerPoint design contains a slide that will help you in detailing the unique selling points of your company. Using this corporate publicity PPT layout will help you talk about the key historical events of your company. Incorporating this company investment PPT theme lets you determine a profitable business model for your company. This pitch finance promotion PowerPoint creative set contains a slide that relays the competitive advantage to the business. This investment fund transfer PowerPoint creative set contains a slide that has all the important icons related to the investment pitch deck. Download this PPT slide to explore true perfection.
- Google Slides is a new FREE Presentation software from Google.
- All our content is 100% compatible with Google Slides.
- Just download our designs, and upload them to Google Slides and they will work automatically.
- Amaze your audience with SlideTeam and Google Slides.
-
Want Changes to This PPT Slide? Check out our Presentation Design Services
- WideScreen Aspect ratio is becoming a very popular format. When you download this product, the downloaded ZIP will contain this product in both standard and widescreen format.
-

- Some older products that we have may only be in standard format, but they can easily be converted to widescreen.
- To do this, please open the SlideTeam product in Powerpoint, and go to
- Design ( On the top bar) -> Page Setup -> and select "On-screen Show (16:9)” in the drop down for "Slides Sized for".
- The slide or theme will change to widescreen, and all graphics will adjust automatically. You can similarly convert our content to any other desired screen aspect ratio.
Compatible With Google Slides

Get This In WideScreen
You must be logged in to download this presentation.
PowerPoint presentation slides
Presenting our investor pitch presentation to raise funds from financial market complete PPT deck. This PowerPoint design contains sixty slides in it which can be completely customized and edited. It is available for both standard as well as for widescreen formats. This PowerPoint template is compatible with all the presentation software like Microsoft Office, Google Slides, etc. You can download this PPT layout from below.
People who downloaded this PowerPoint presentation also viewed the following :
Content of this Powerpoint Presentation
Slide 1: This slide introduces Investor Pitch Presentation to Raise Funds from Financial Market. State Your Company Name and begin.
Slide 2: This slide shows Agenda for Raise Funding from Financial Market.
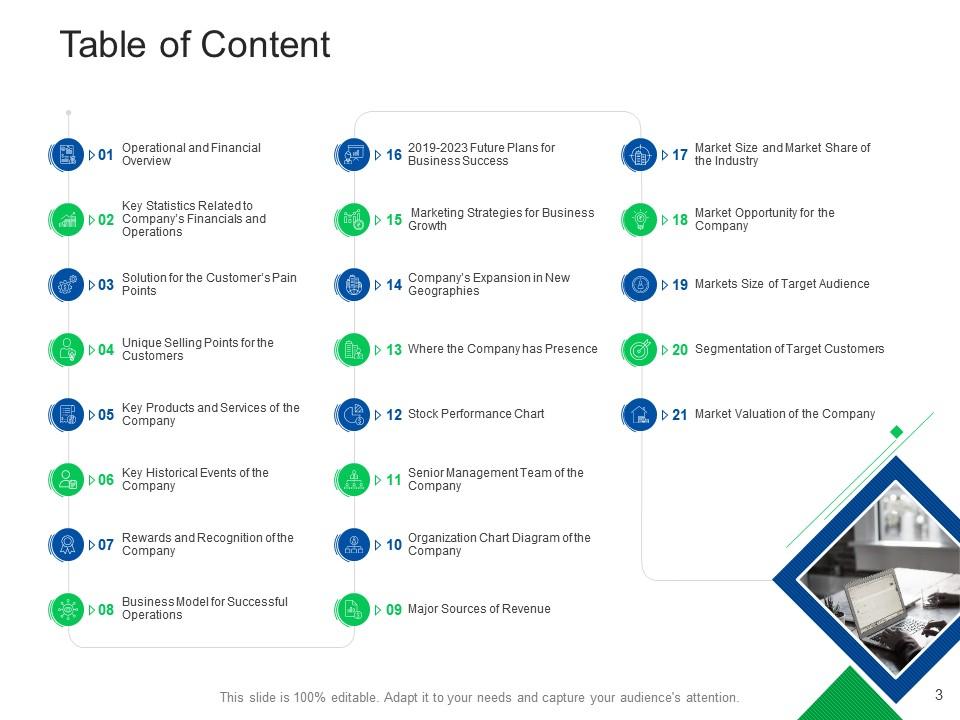
Slide 3: This slide presents Table of Content for the presentation.
Slide 4: This slide shows Table of Content for the presentation.
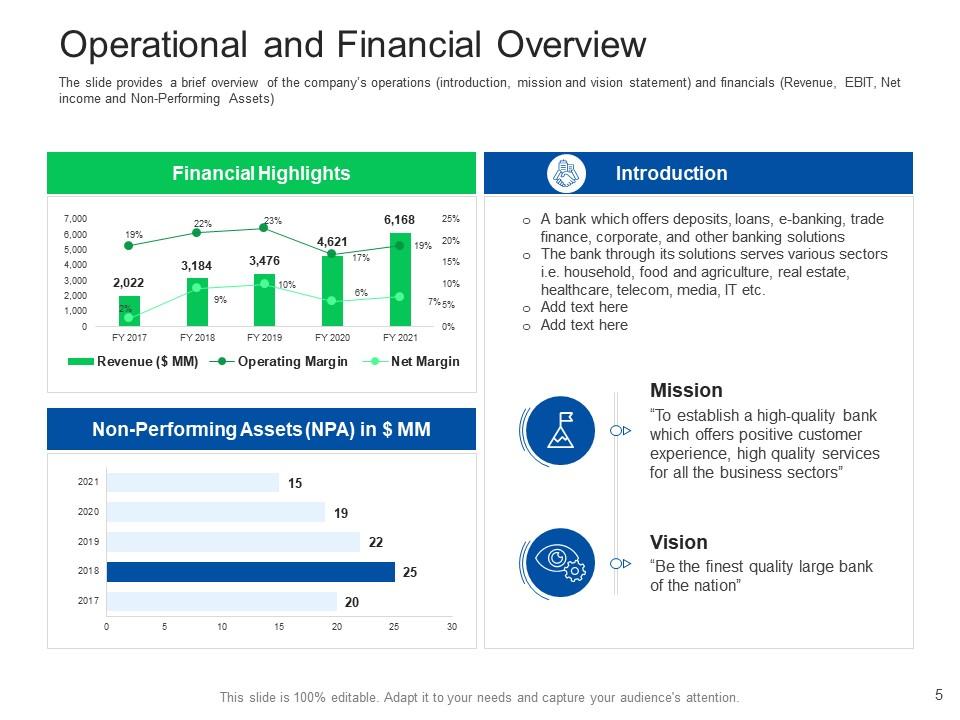
Slide 5: The slide displays a brief overview of the company’s operations (introduction, mission and vision statement).
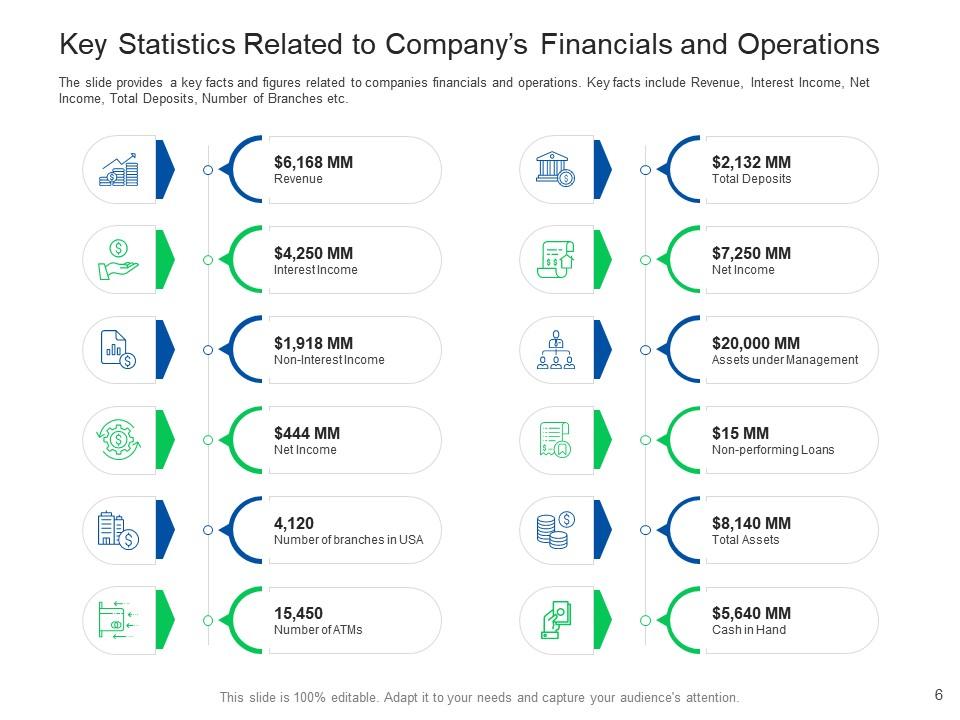
Slide 6: This slide represents Key Statistics Related to Company’s Financials and Operations.
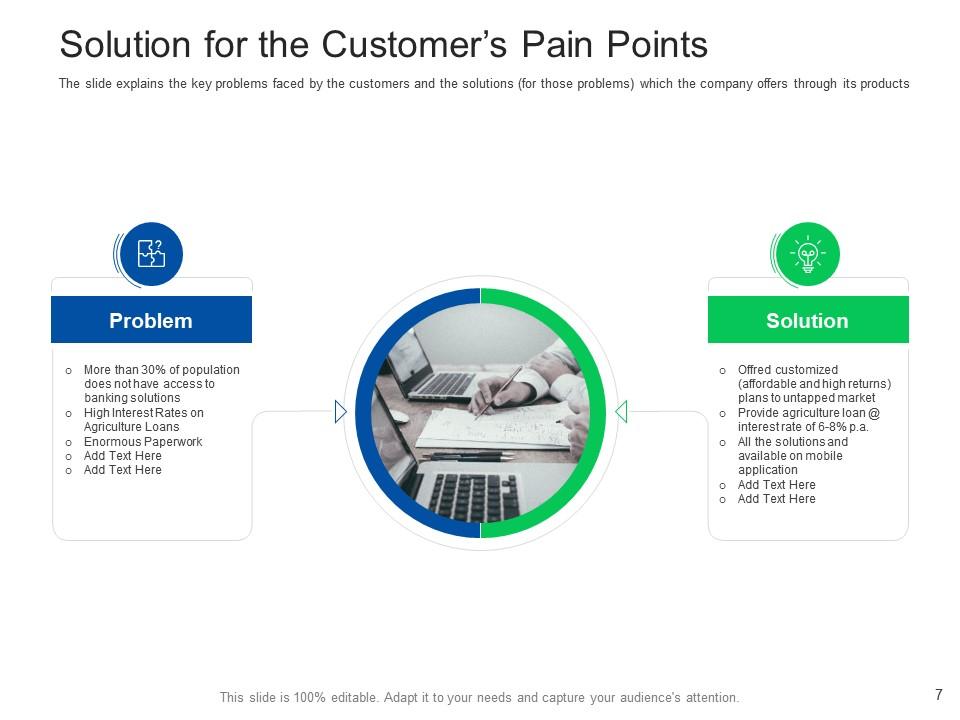
Slide 7: The slide explains the key problems faced by the customers and the solutions (for those problems) which the company offers through its products.
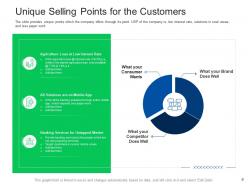
Slide 8: The slide presents unique points which the company offers through its point.
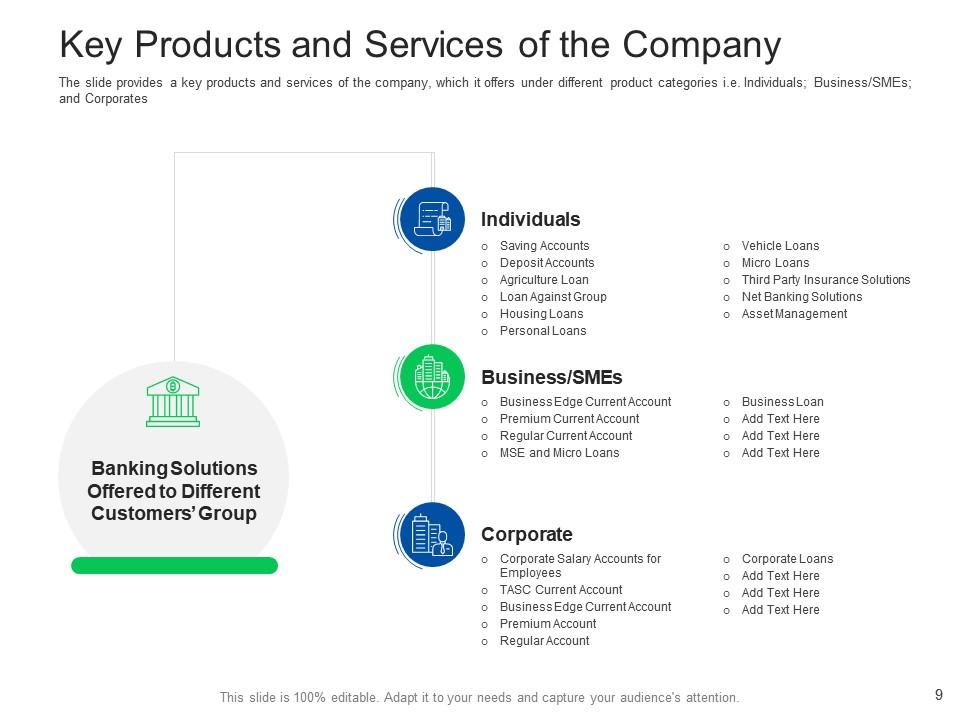
Slide 9: This slide shows Banking Solutions Offered to Different Customers’ Group.
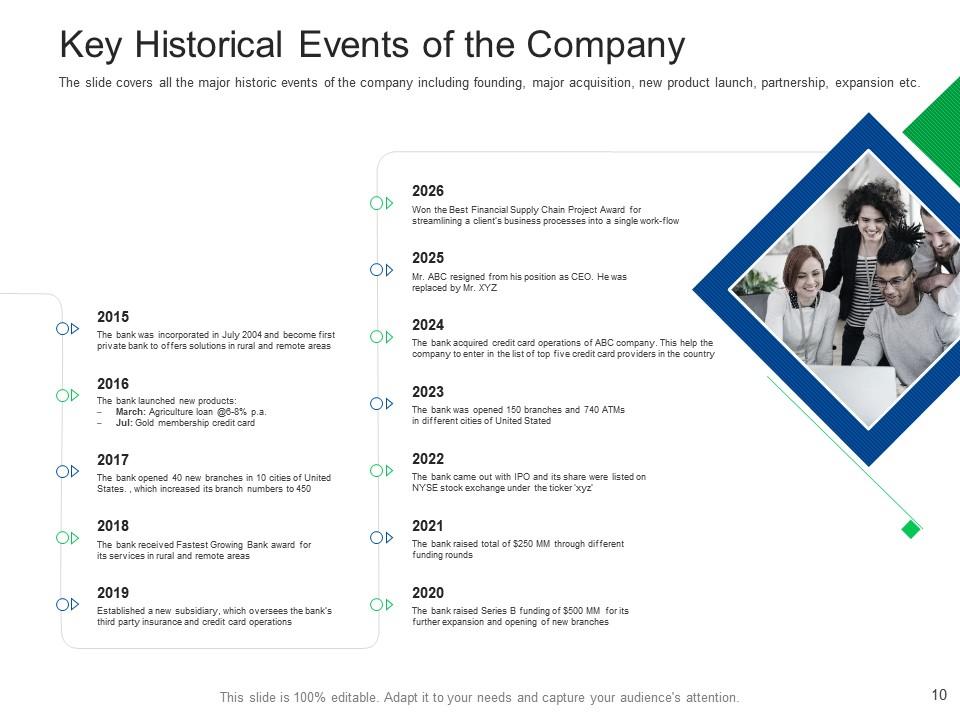
Slide 10: The slide displays all the major historic events of the company including founding, major acquisition, new product launch, partnership, expansion etc.
Slide 11: The slide represents all the major historic events of the company including founding, major acquisition, new product launch, partnership, expansion etc.
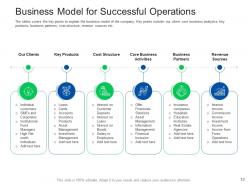
Slide 12: This slide shows Business Model for Successful Operations.
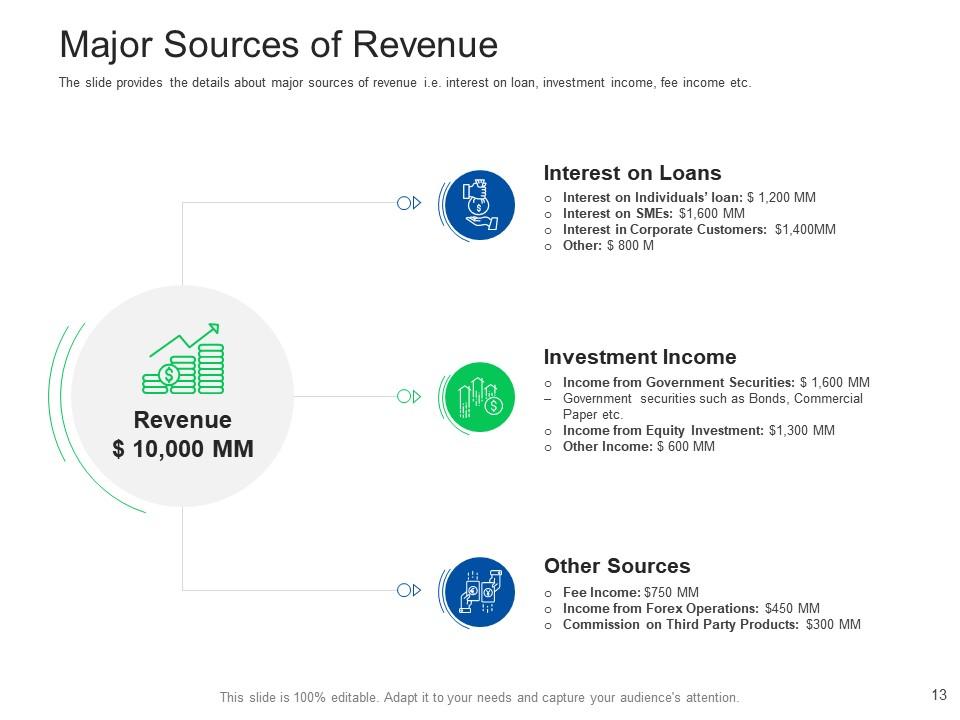
Slide 13: The slide presents the details about major sources of revenue i.e. interest on loan, investment income, fee income etc.
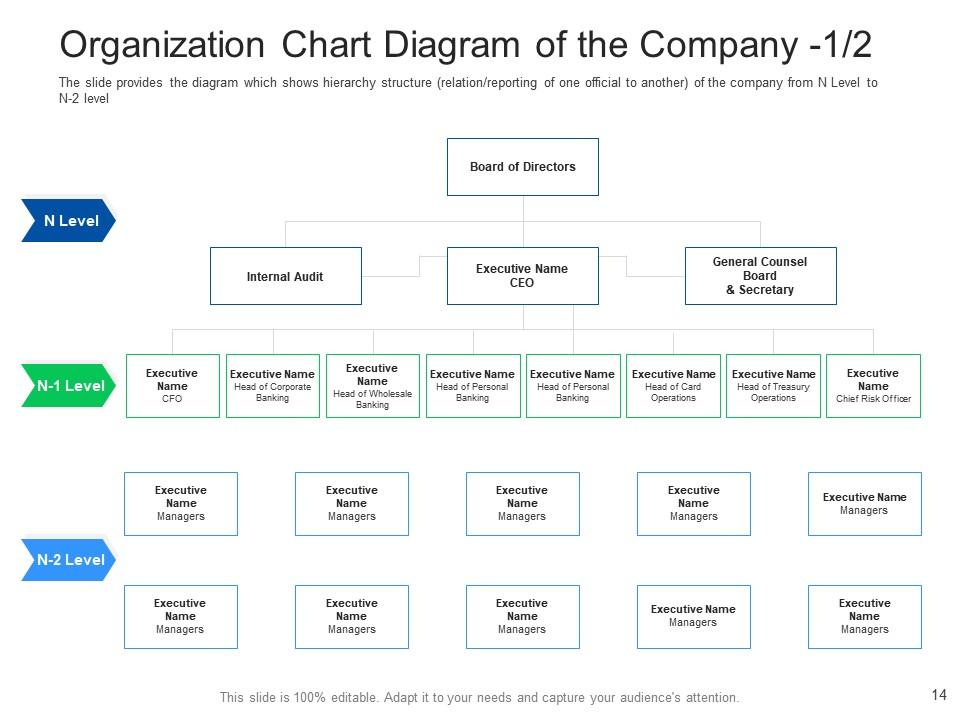
Slide 14: This slide shows Organization Chart Diagram of the Company.
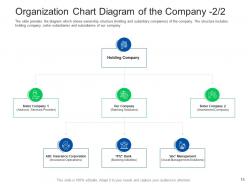
Slide 15: The slide displays the diagram which shows ownership structure (holding and subsidiary companies) of the company.
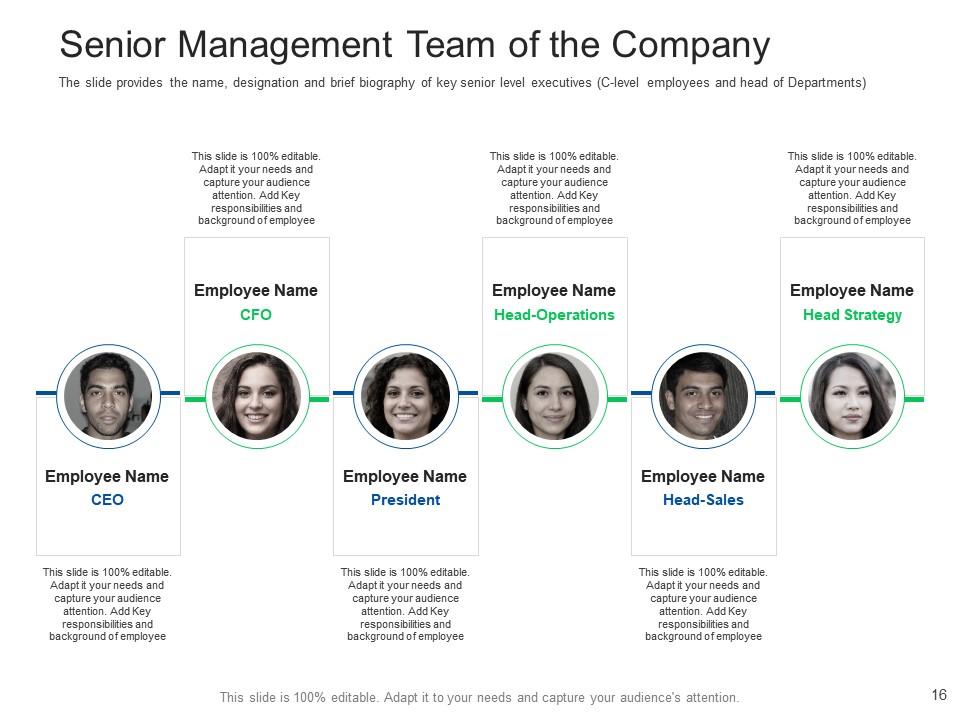
Slide 16: The slide represents the name, designation and brief biography of key senior level executives (C-level employees and head of Departments).
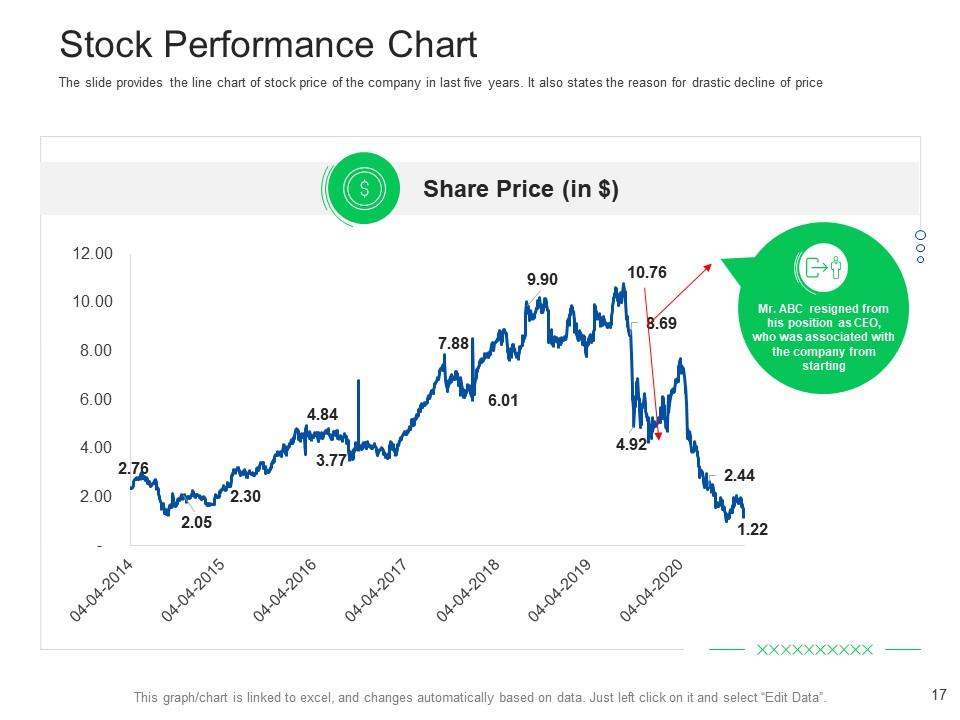
Slide 17: The slide provides the line chart of stock price of the company in last five years.
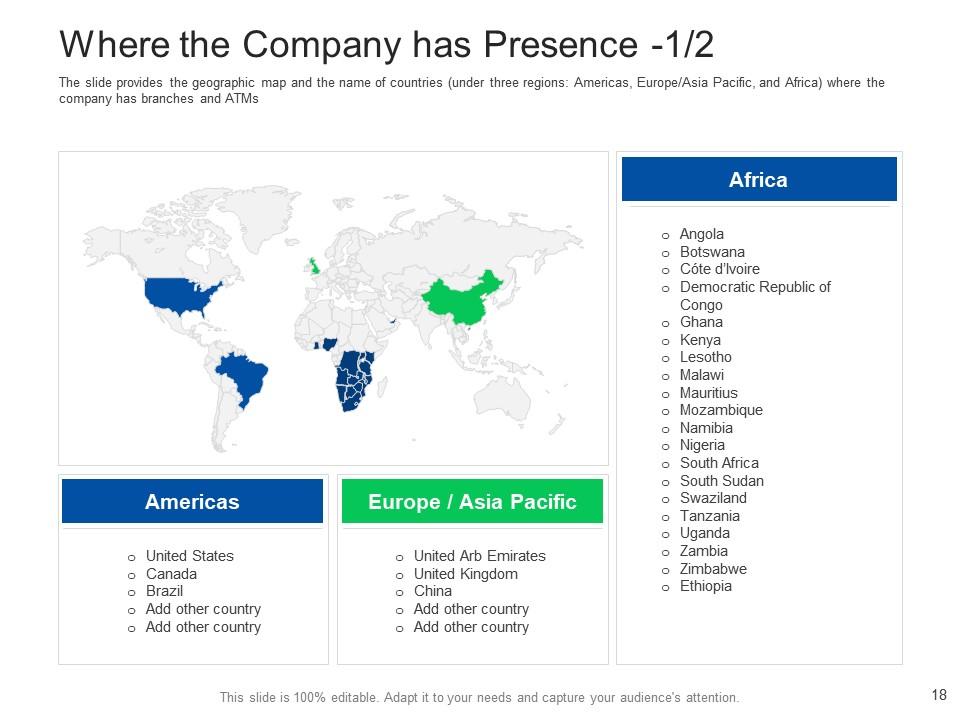
Slide 18: The slide presents the geographic map and the name of countries (under three regions: Americas, Europe/Asia Pacific, and Africa) where the company has branches and ATMs.
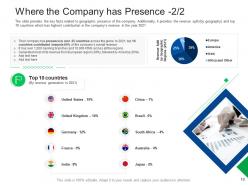
Slide 19: The slide provides the key facts related to geographic presence of the company.
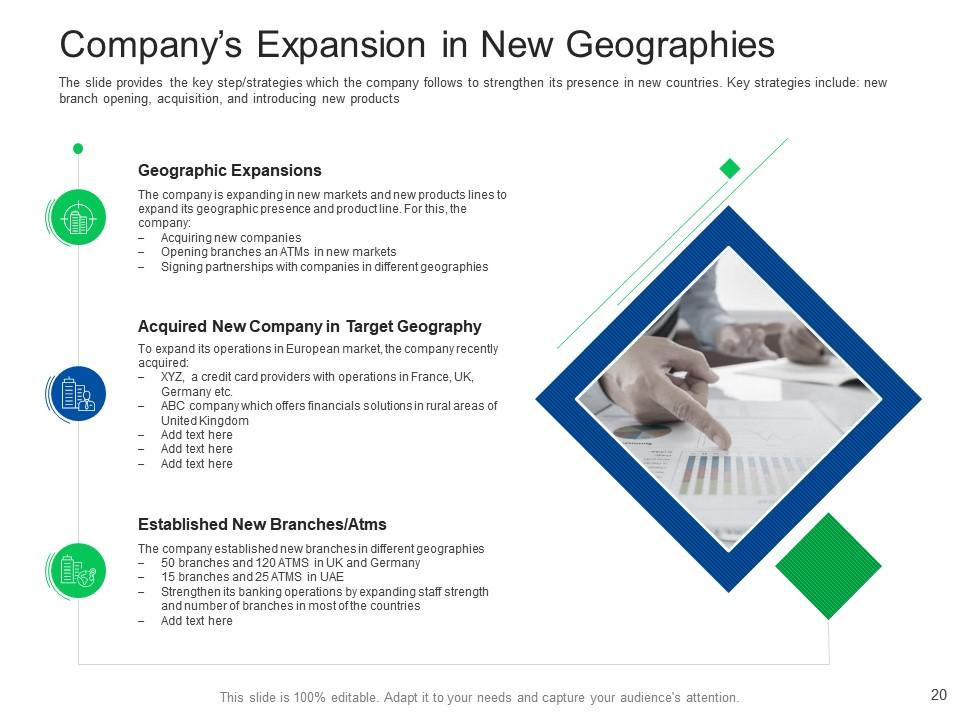
Slide 20: The slide displays the key step/strategies which the company follows to strengthen its presence in new countries.
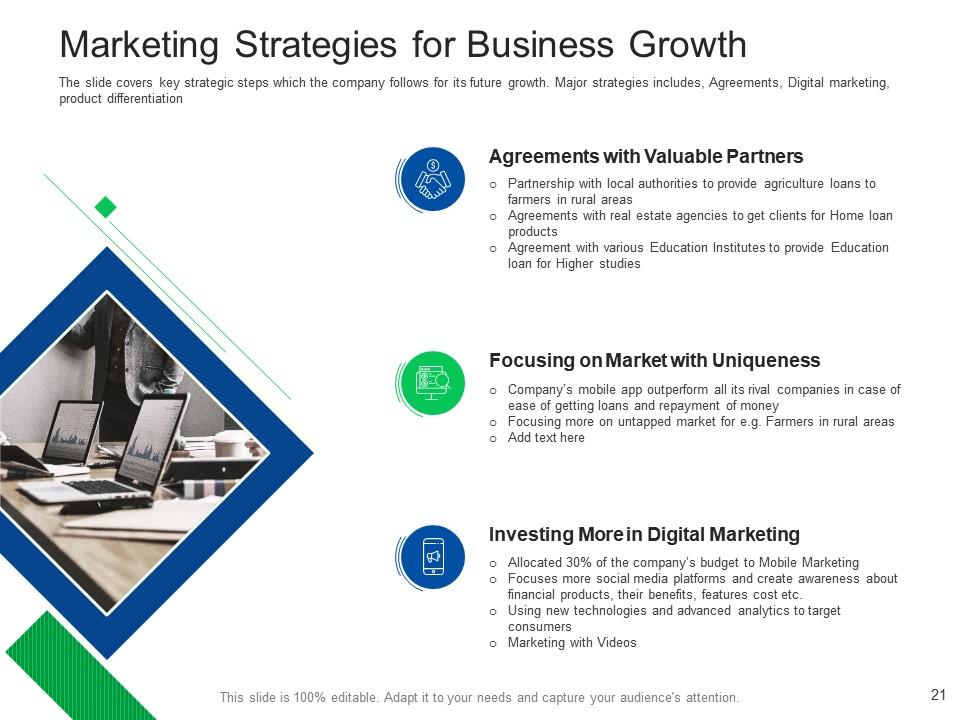
Slide 21: The slide represents key strategic steps which the company follows for its future growth.
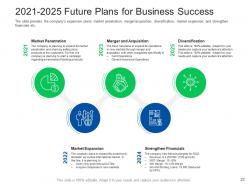
Slide 22: The slide provides the company’s expansion plans: market penetration, merger/acquisition, diversification, market expansion, and strengthen financials etc.
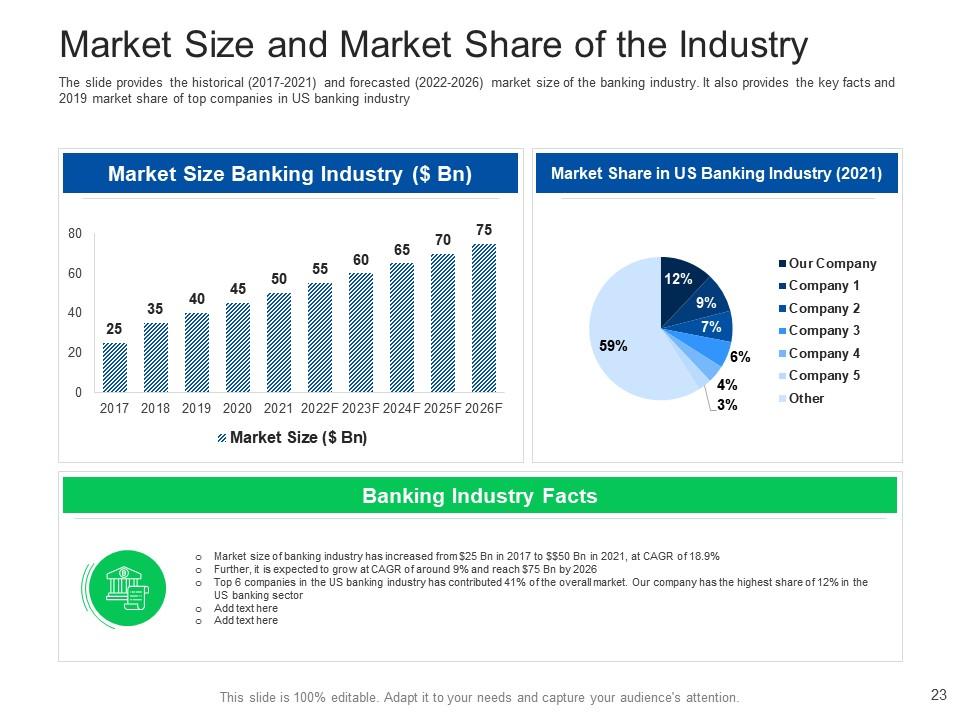
Slide 23: This slide presents Market Size and Market Share of the Industry.
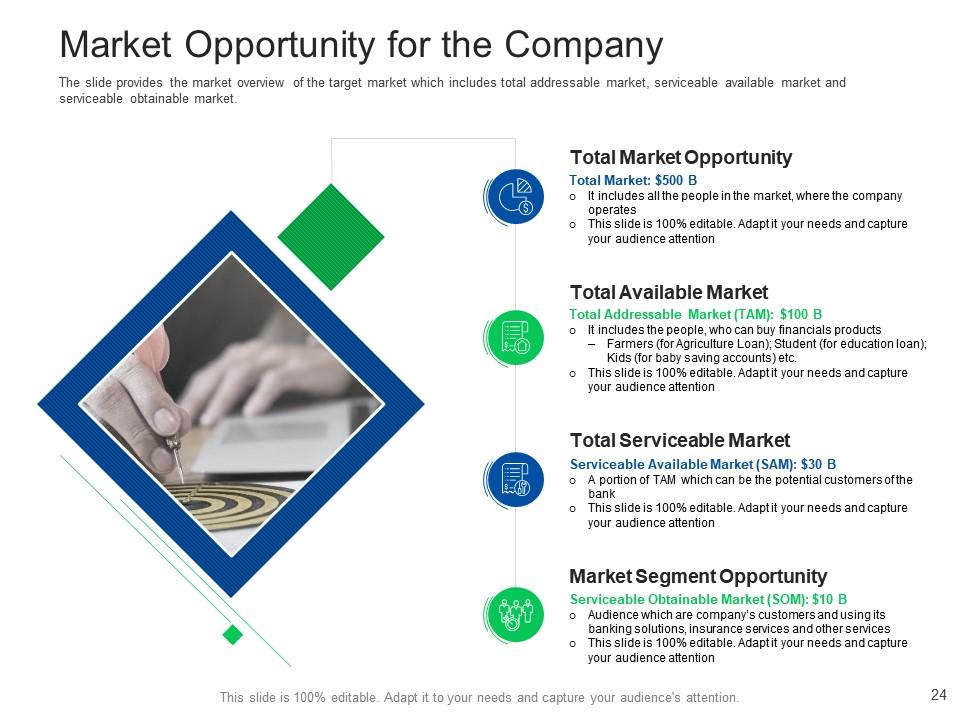
Slide 24: The slide provides the market overview of the target market which includes total addressable market, serviceable available market and serviceable obtainable market.
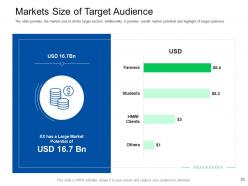
Slide 25: The slide displays the market size of all the target sectors.
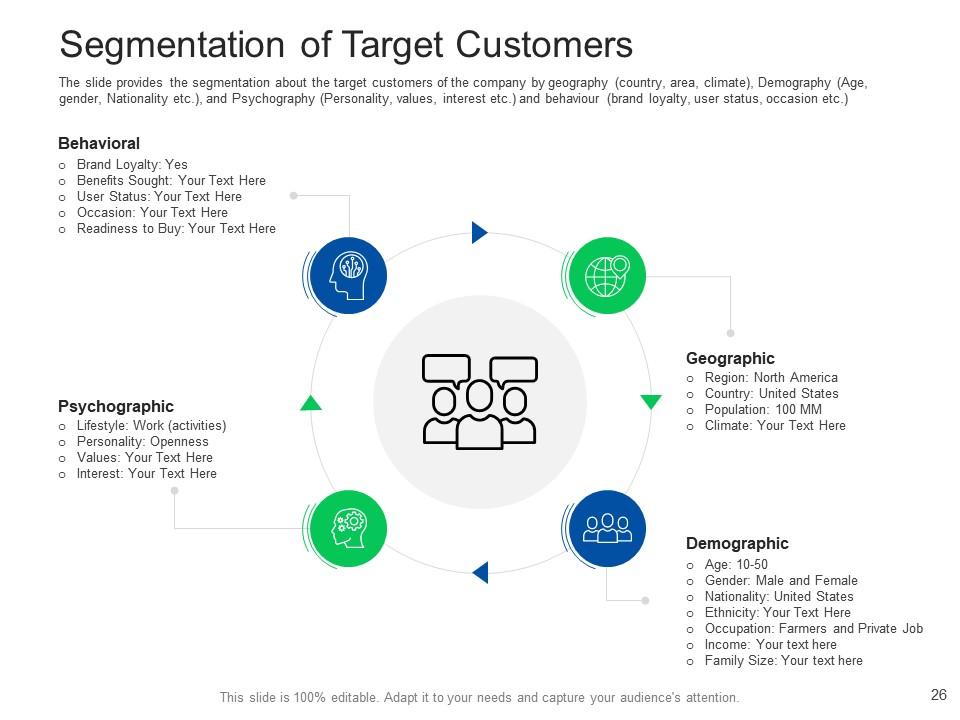
Slide 26: The slide represents the segmentation about the target customers of the company by geography.
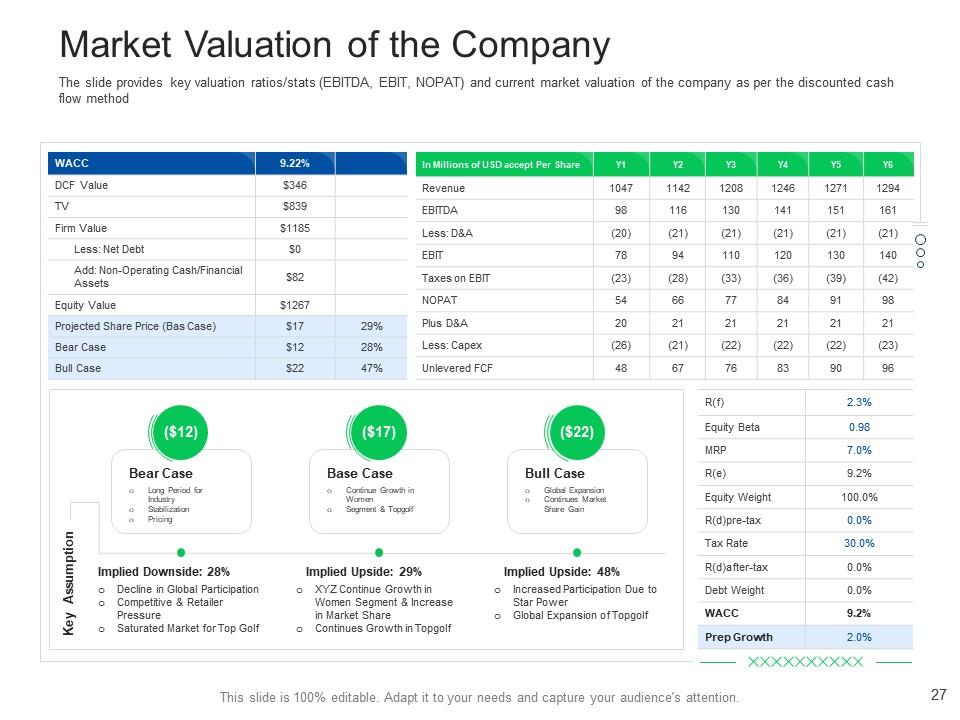
Slide 27: The slide provides key valuation ratios/stats (EBITDA, EBIT, NOPAT) and current market valuation of the company as per the discounted cash flow method.
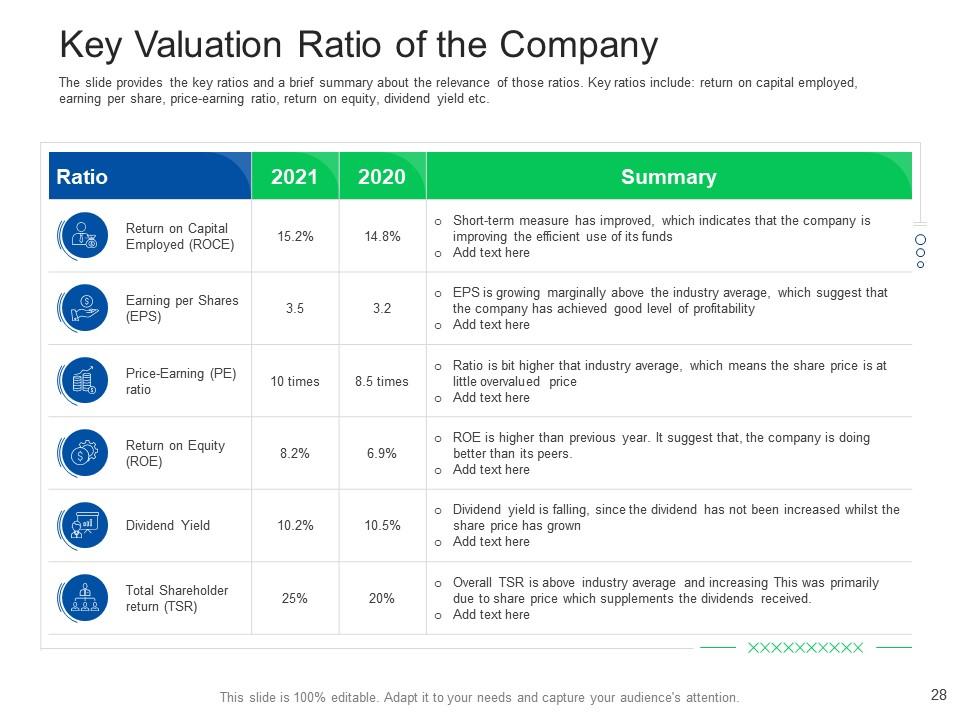
Slide 28: The slide presents the key ratios and a brief summary about the relevance of those ratios.
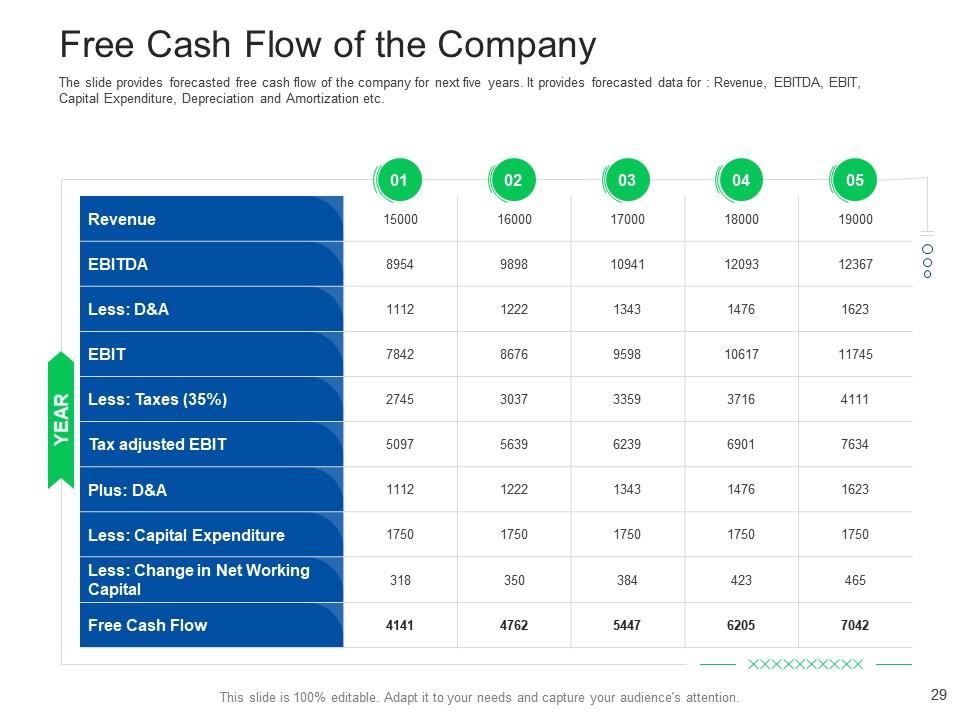
Slide 29: The slide provides forecasted free cash flow of the company for next five years.
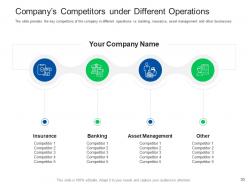
Slide 30: The slide displays the key competitors of the company in different operations i.e. banking, insurance, asset management and other businesses.
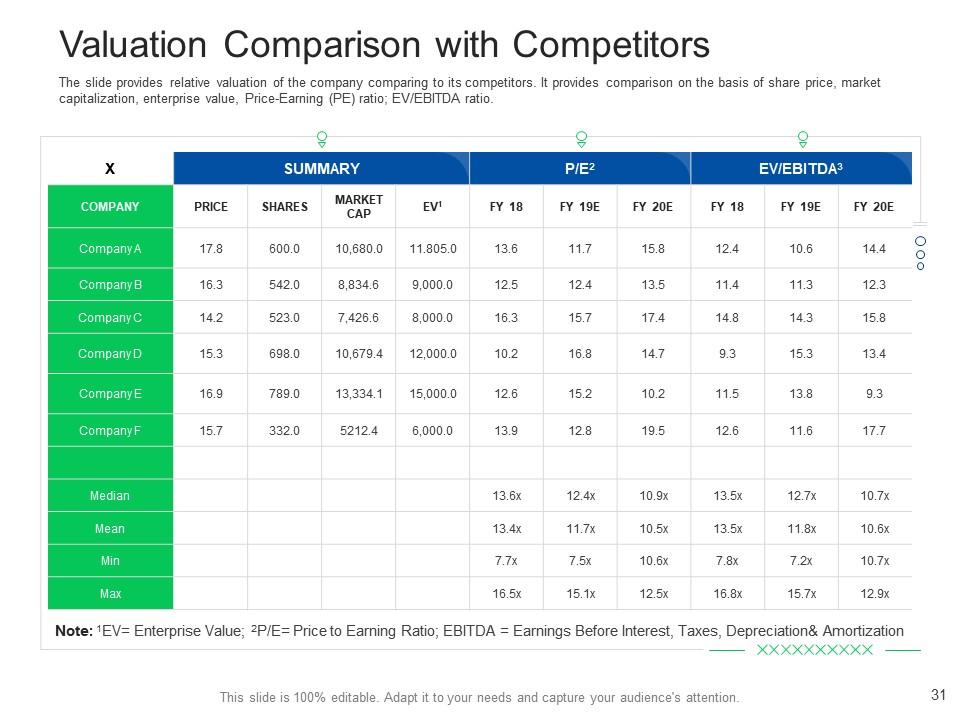
Slide 31: The slide represents relative valuation of the company comparing to its competitors.
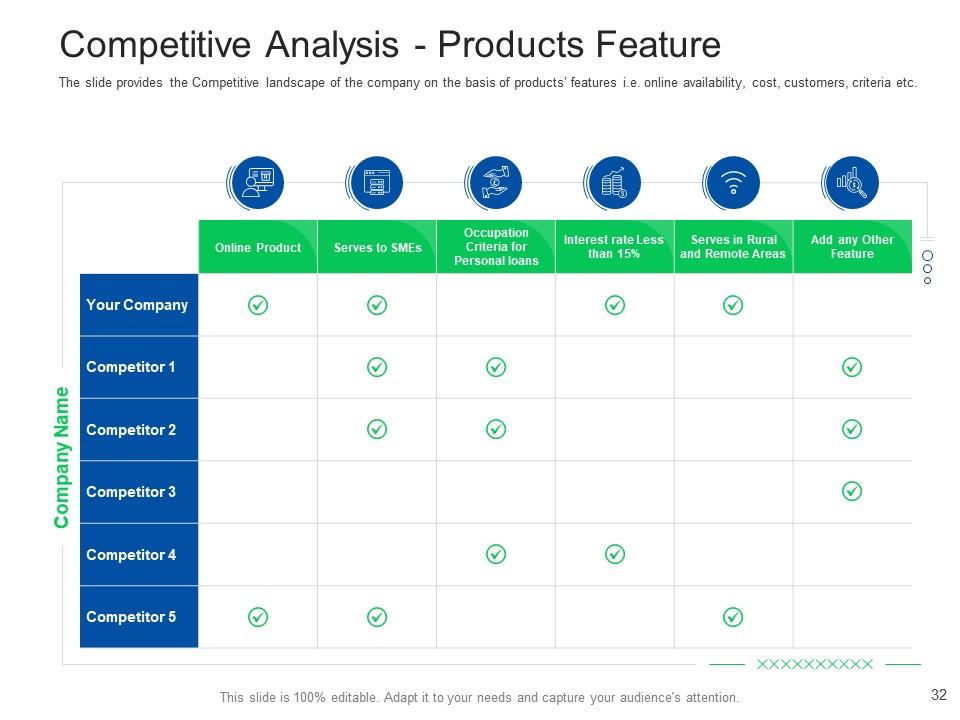
Slide 32: The slide provides the Competitive landscape of the company on the basis of products features.
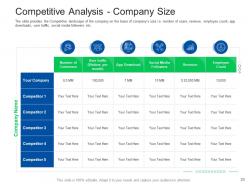
Slide 33: The slide presents the Competitive landscape of the company on the basis of company’s size.
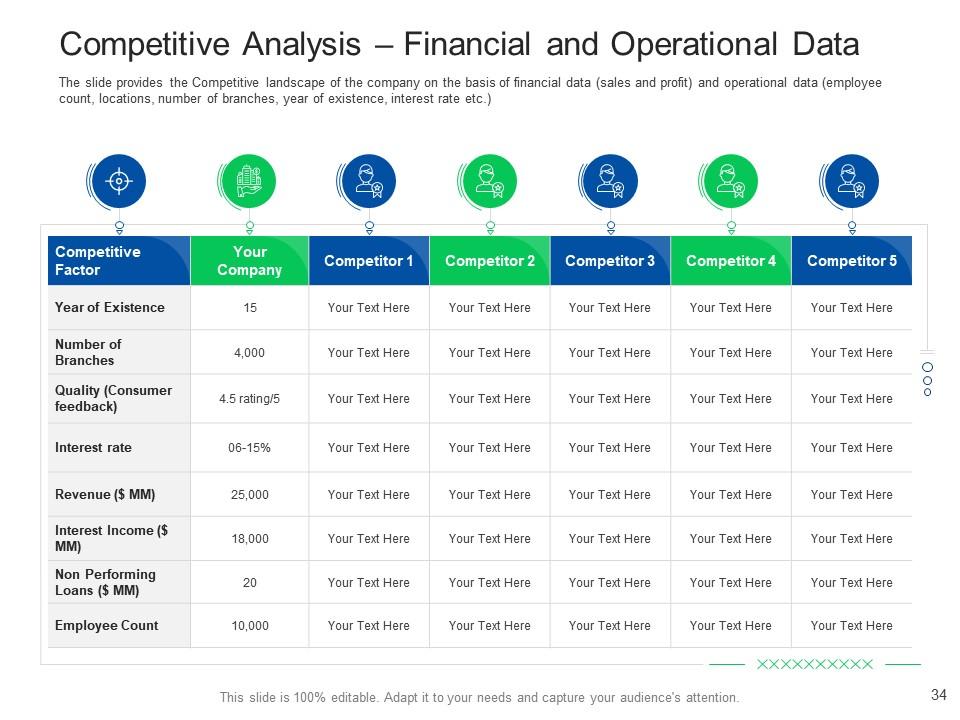
Slide 34: The slide provides the Competitive landscape of the company on the basis of financial data.
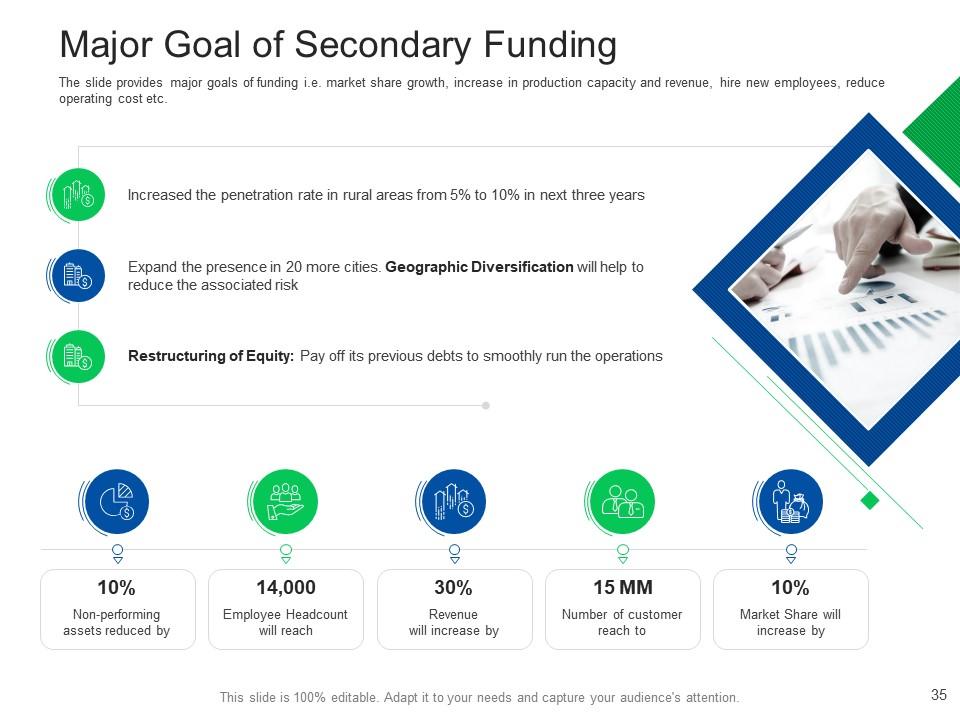
Slide 35: The slide displays major goals of funding i.e. market share growth, increase in production capacity and revenue, hire new employees, reduce operating cost etc.
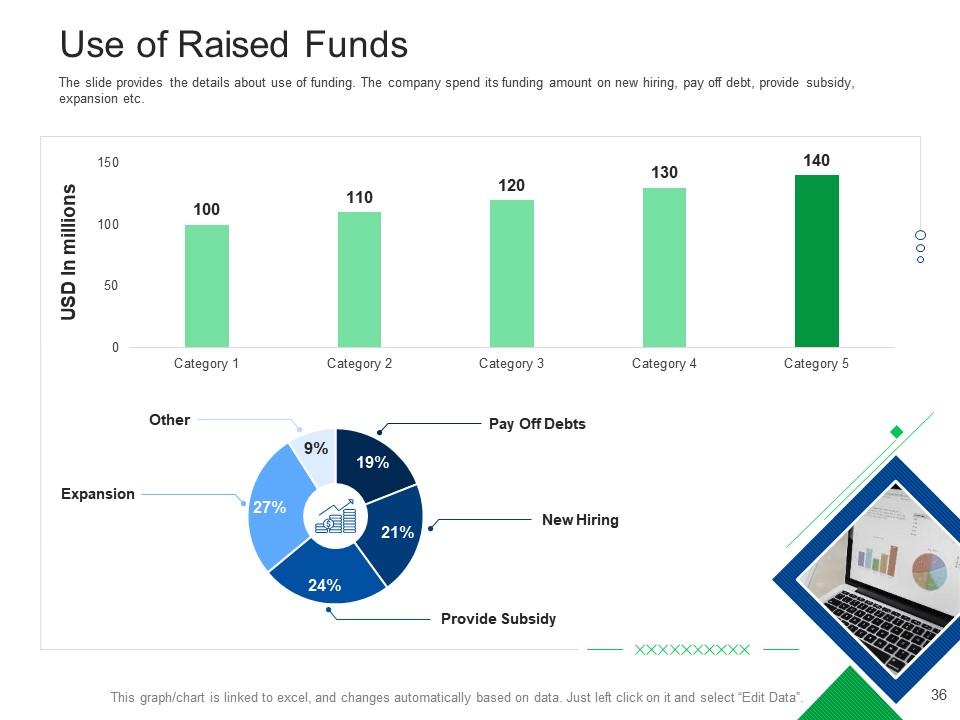
Slide 36: The slide represents the details about use of funding on new hiring, pay off debt, provide subsidy, expansion etc.
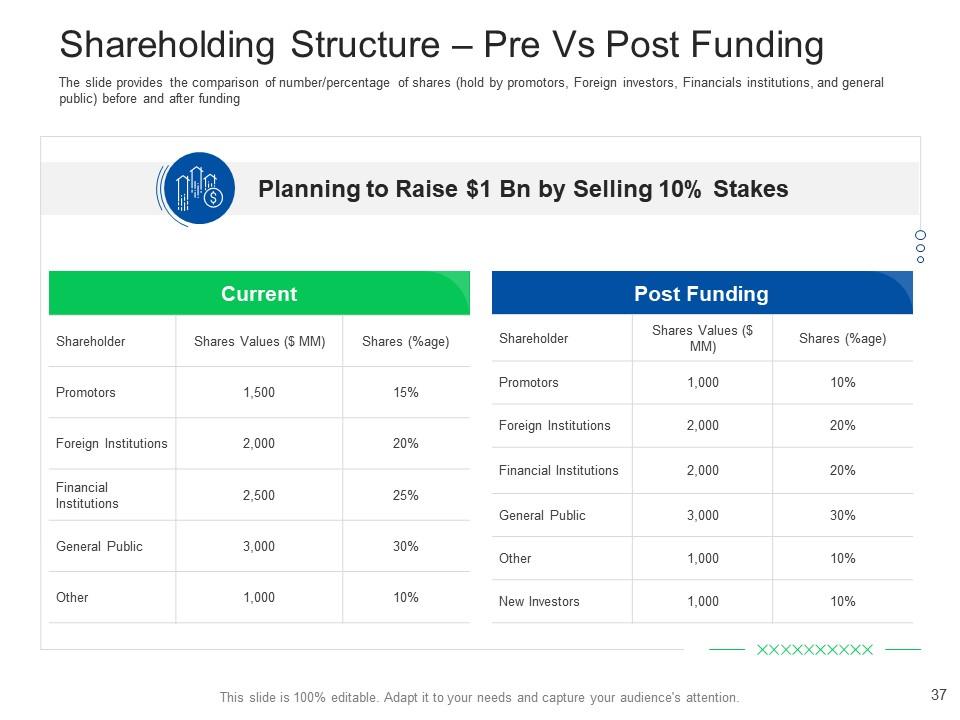
Slide 37: The slide provides the comparison of number/percentage of shares (hold by promotors, Foreign investors, Financials institutions, and general public) before and after funding.
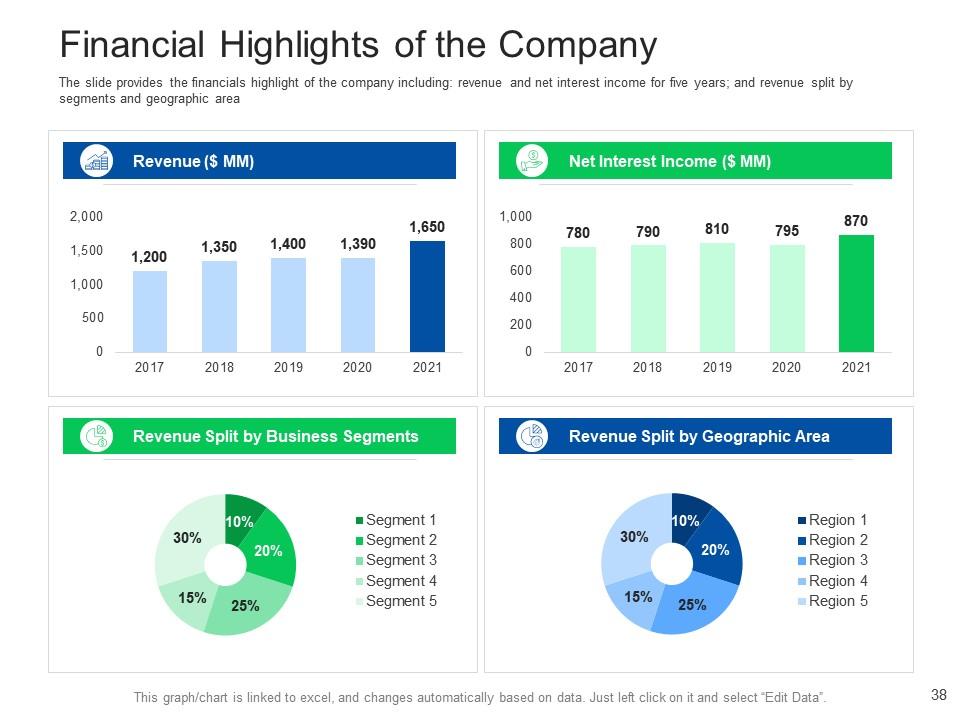
Slide 38: The slide presents the financials highlight of the company including: revenue and net interest income for five years.
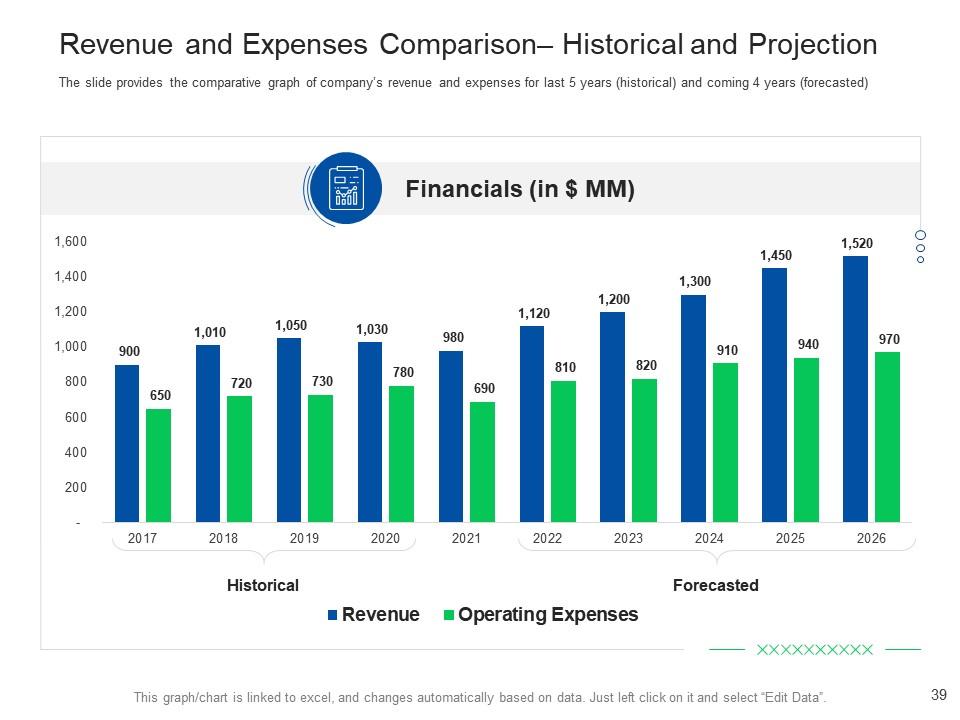
Slide 39: This slide shows Revenue and Expenses Comparison– Historical and Projection.
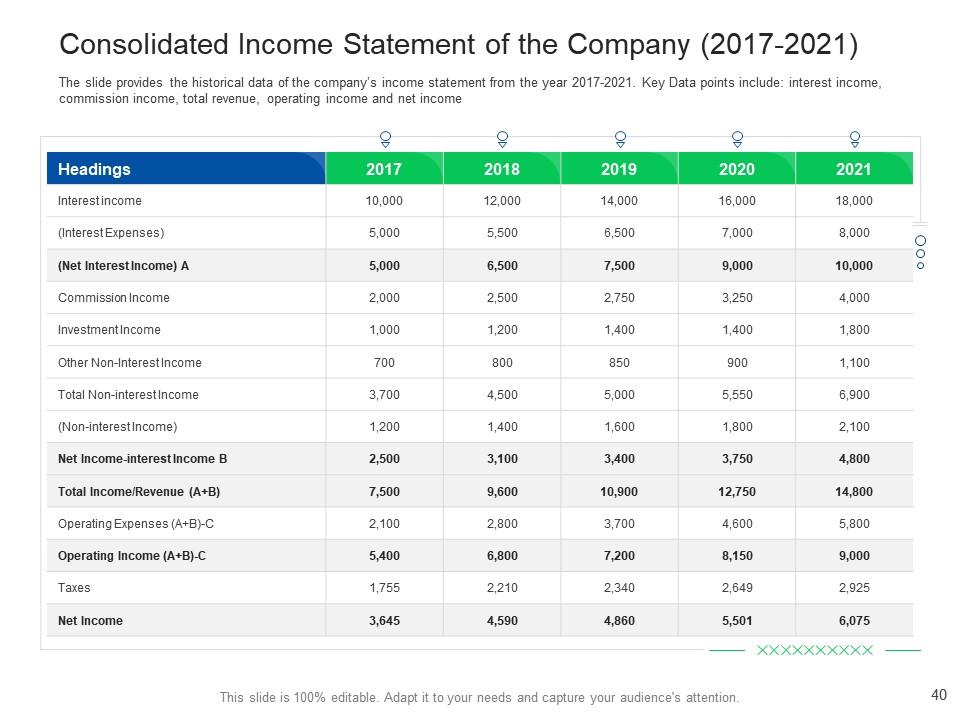
Slide 40: The slide displays the historical data of the company’s income statement from the year 2015-2019.
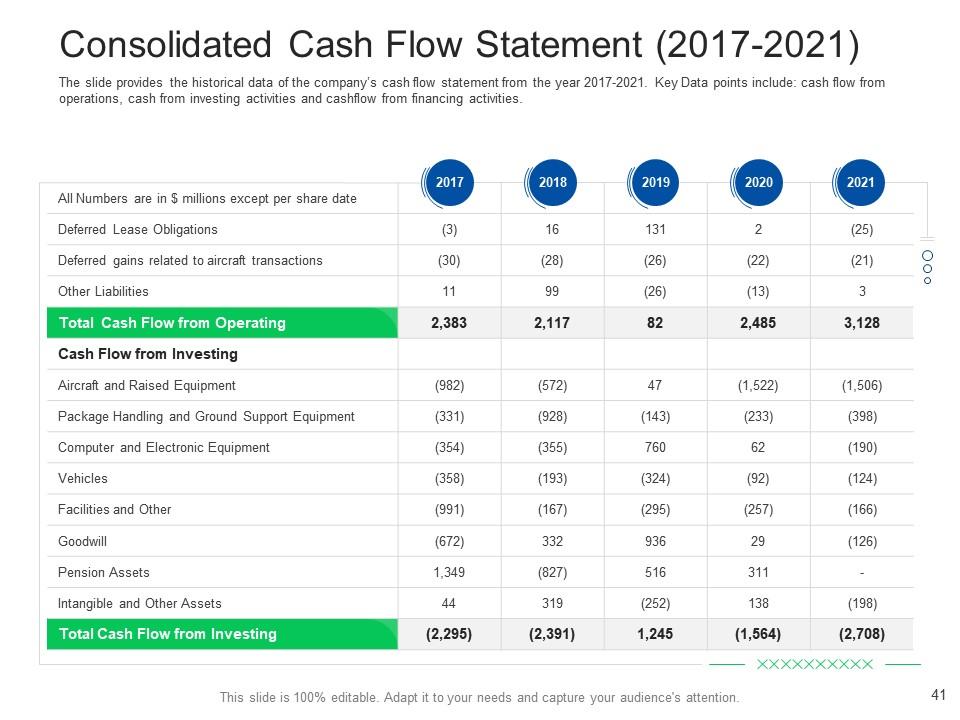
Slide 41: The slide represents the historical data of the company’s cash flow statement.
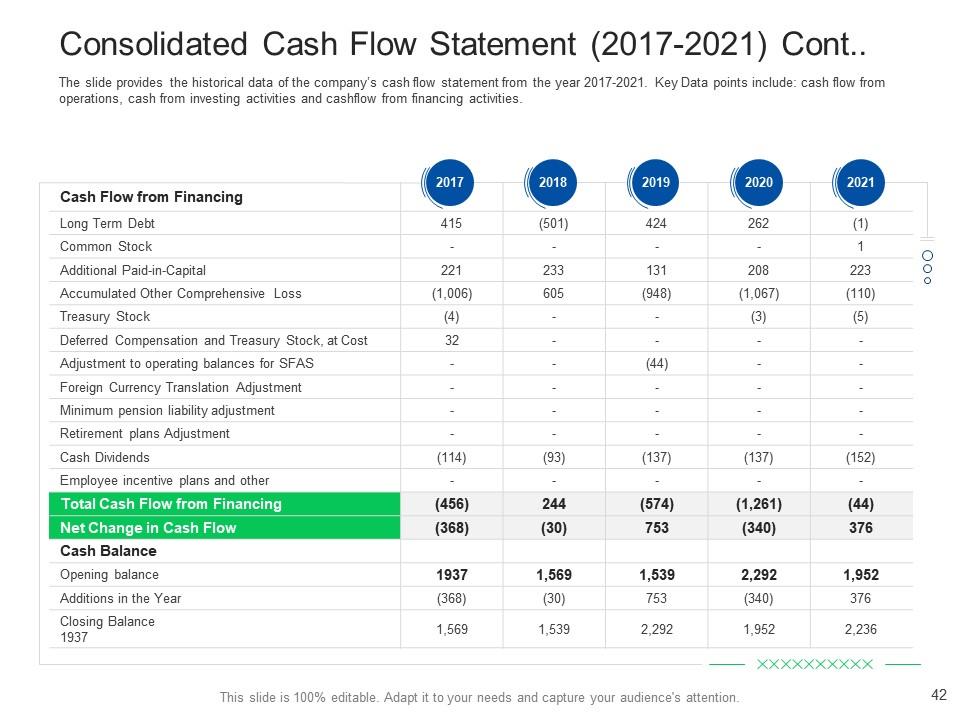
Slide 42: The slide provides the historical data of the company’s cash flow statement from the year 2015-2019.
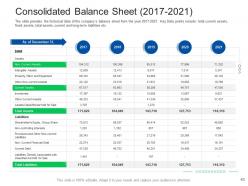
Slide 43: The slide presents the historical data of the company’s balance sheet from the year 2015-2019.
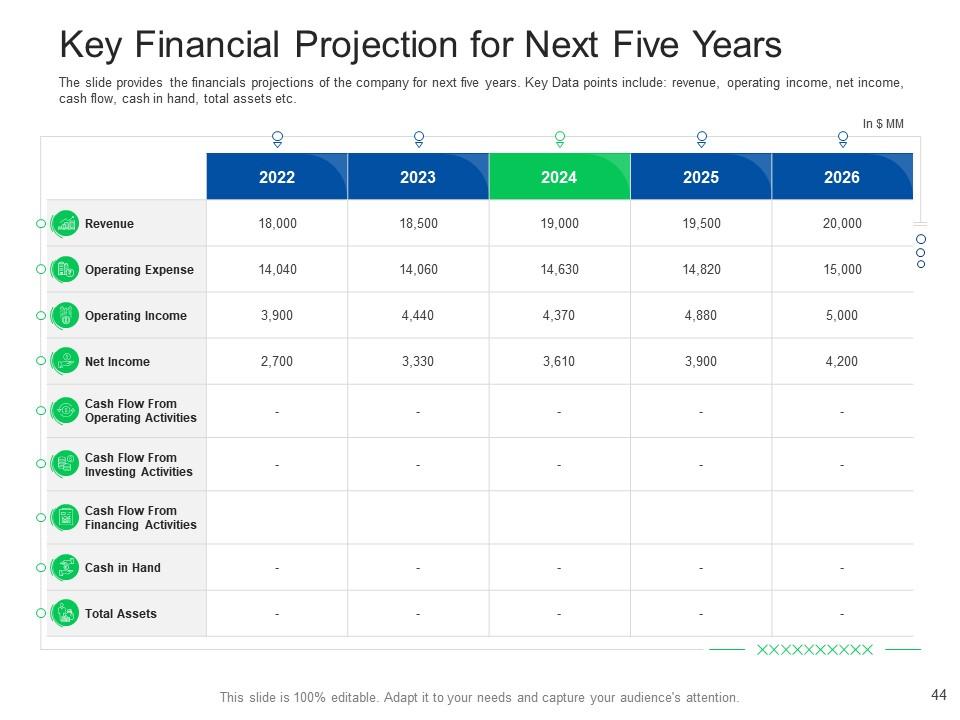
Slide 44: The slide provides the financials projections of the company for next five years.
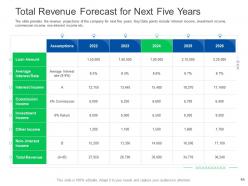
Slide 45: The slide displays the revenue projections of the company for next five years.
Slide 46: The slide represents the client’s person reviews about the products and services of the company.
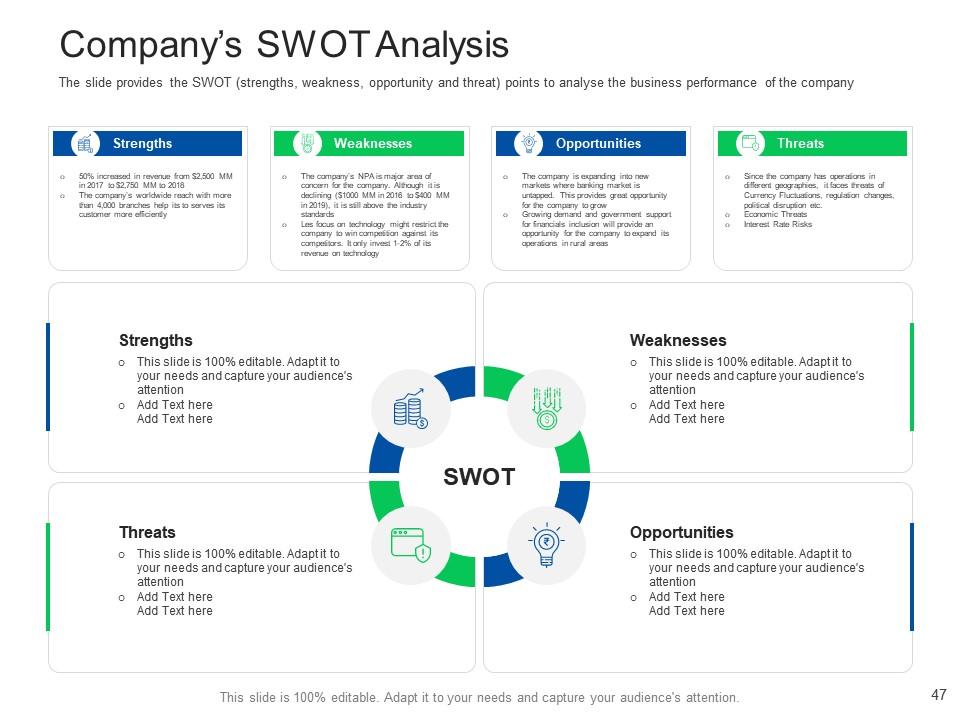
Slide 47: The slide presents the SWOT (strengths, weakness, opportunity and threat) points to analyse the business performance of the company
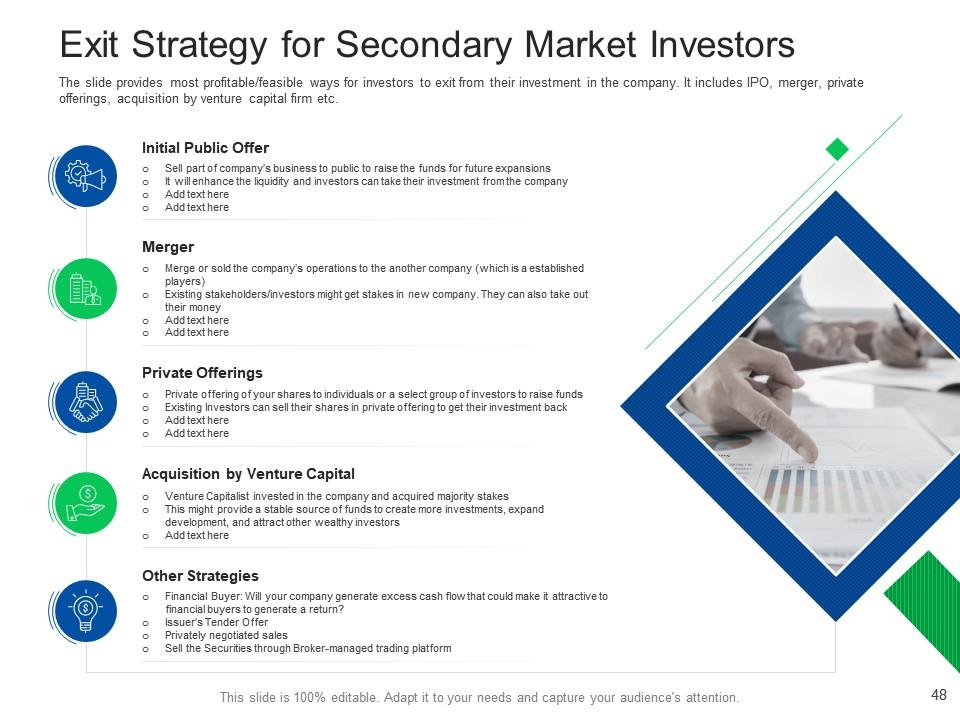
Slide 48: The slide provides most profitable/feasible ways for investors to exit from their investment in the company.
Slide 49: This slide shows Investor Pitch Presentation to Raise Funds from Financial Market -Icons.
Slide 50: This slide is titled as Additional Slides for moving forward.
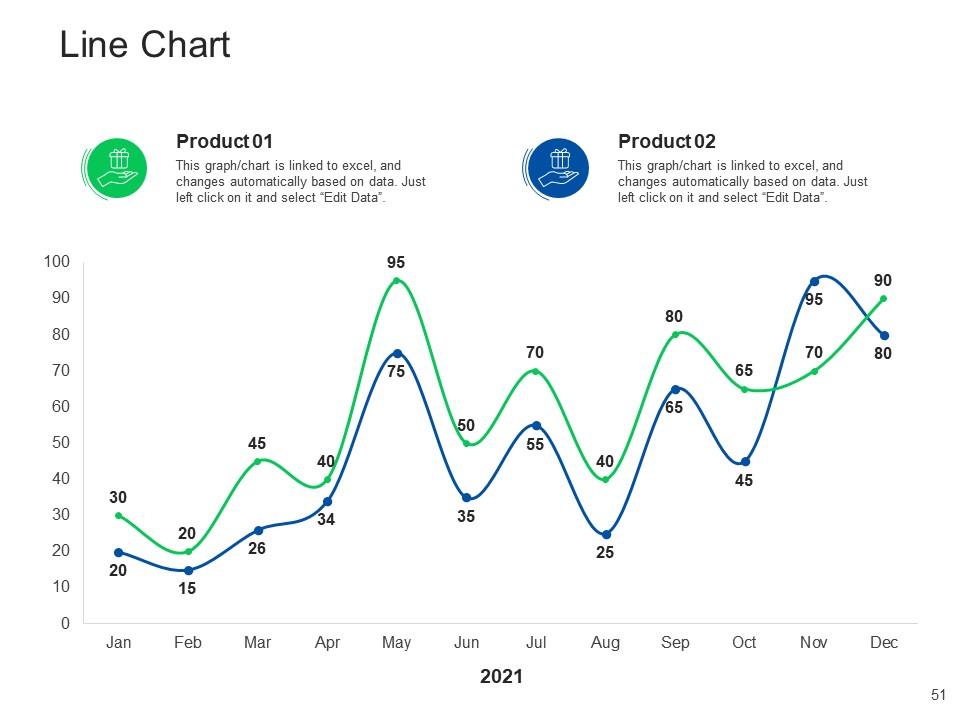
Slide 51: This slide displays Line Chart with two products comparison.
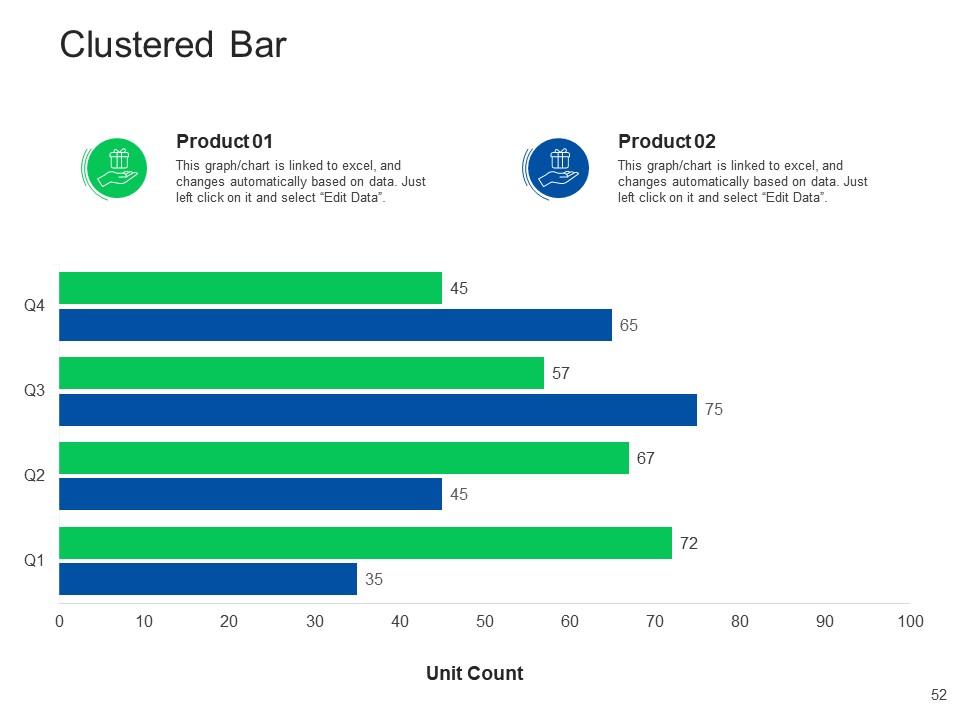
Slide 52: This slide represents Clustered Bar Chart with two products comparison.
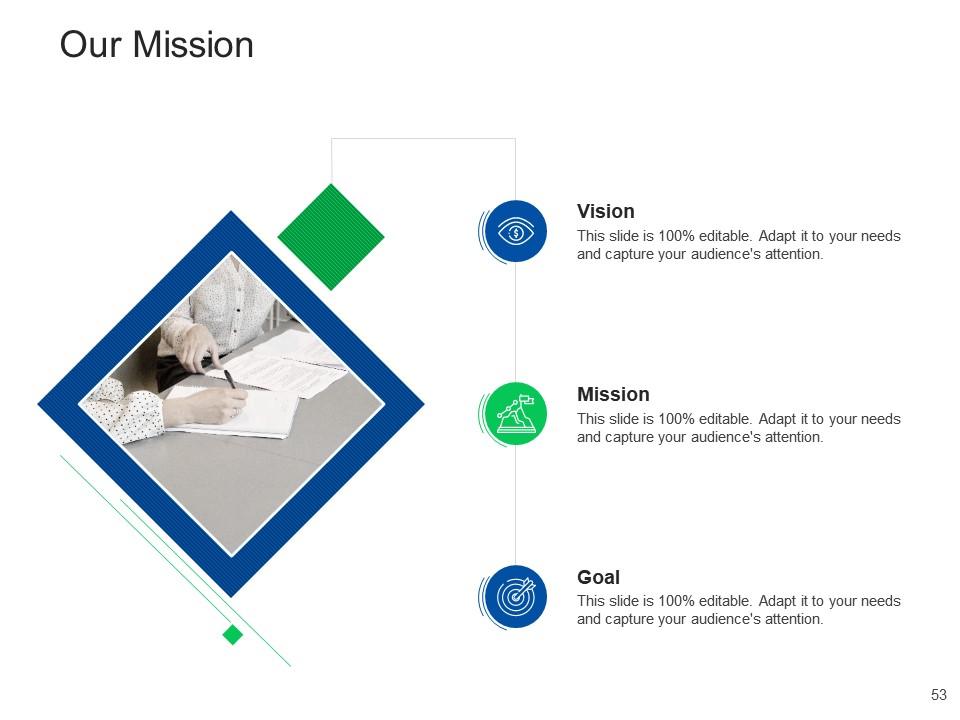
Slide 53: This is Our Mission slide with related imagery and text.
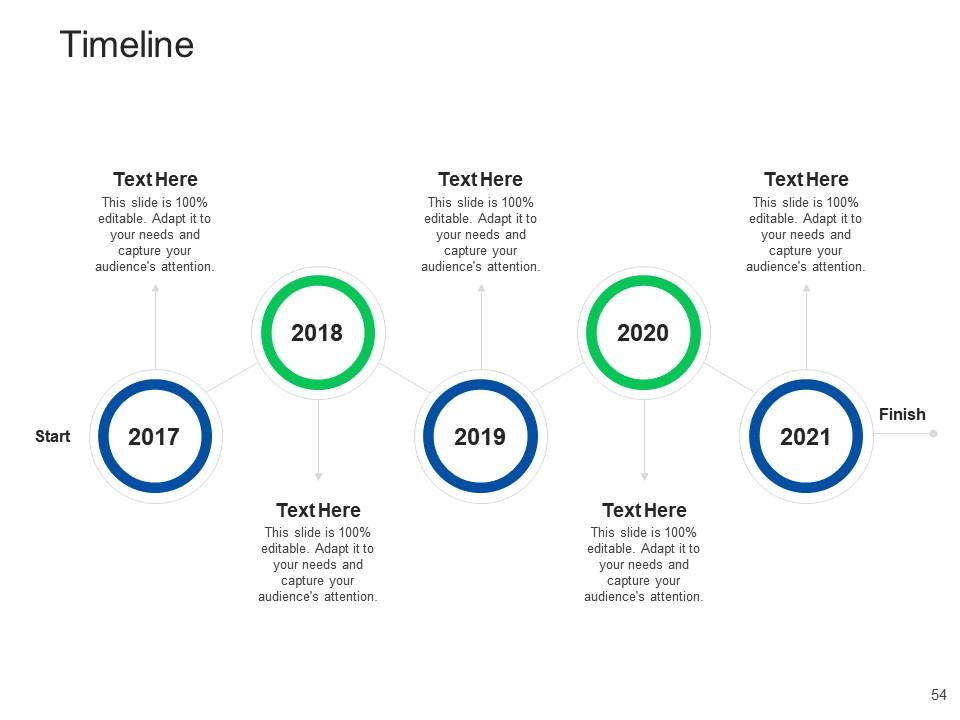
Slide 54: This is a Timeline slide. Show data related to time intervals here.
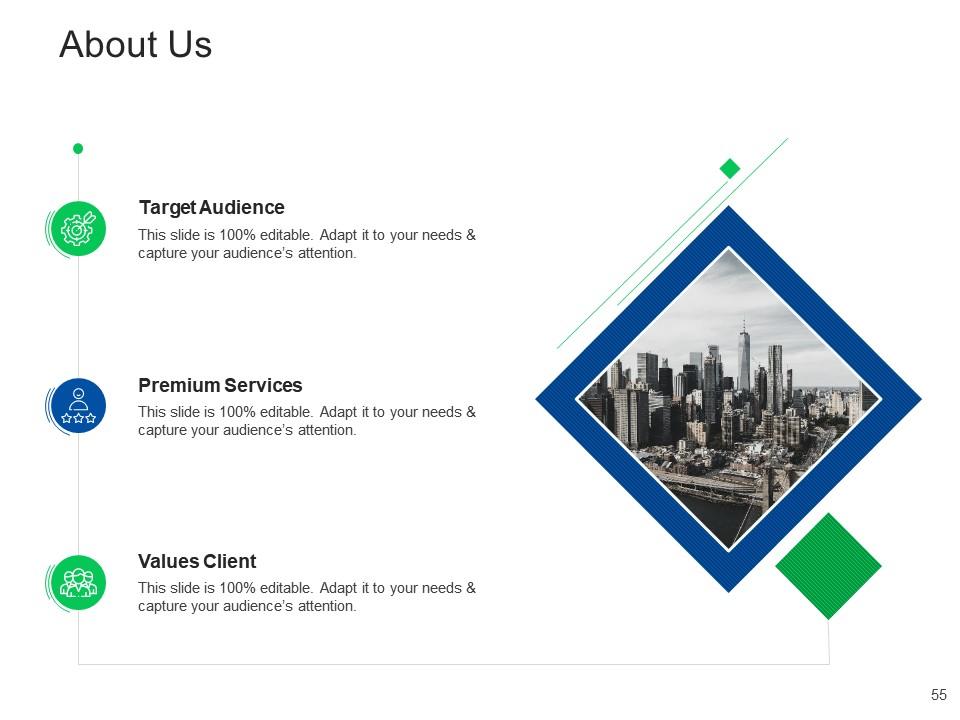
Slide 55: This is About Us slide to show company specifications etc.
Slide 56: This slide shows Post It Notes. Post your important notes here.
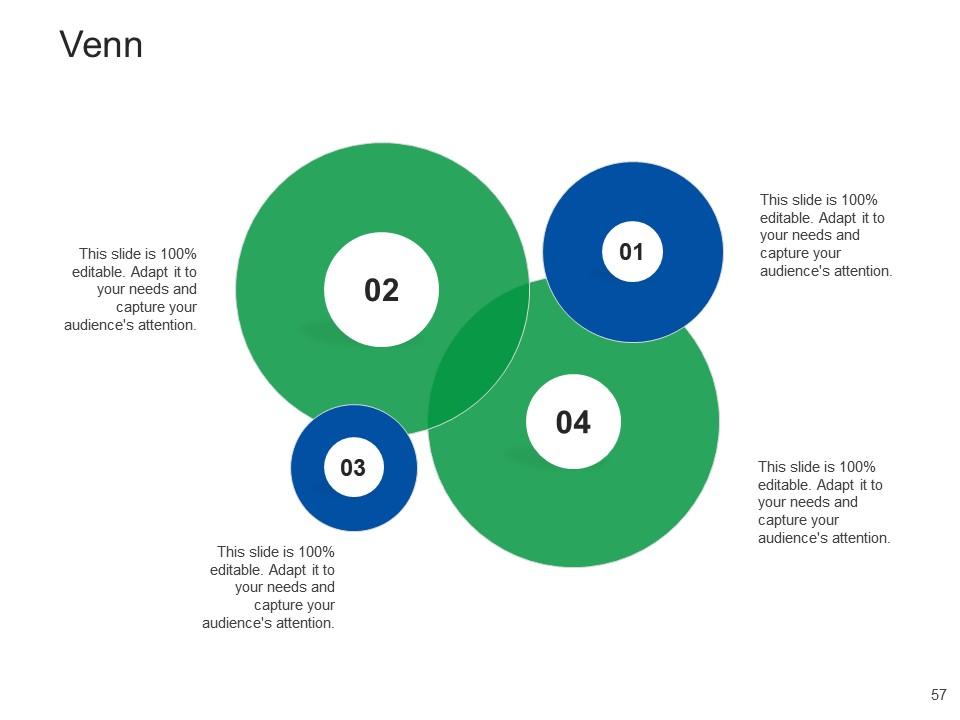
Slide 57: This slide displays Venn diagram with text boxes.
Slide 58: This is a Location slide with maps to show data related with different locations.
Slide 59: This is Our Target slide. State your targets here.
Slide 60: This is a Thank You slide with address, contact numbers and email address.
Investor pitch presentation to raise funds from financial market complete deck with all 60 slides:
Use our Investor Pitch Presentation To Raise Funds From Financial Market Complete Deck to effectively help you save your valuable time. They are readymade to fit into any presentation structure.
-
Best Representation of topics, really appreciable.
-
Great designs, really helpful.
-
Informative presentations that are easily editable.
-
Professional and unique presentations.
-
Great experience, I would definitely use your services further.
-
Much better than the original! Thanks for the quick turnaround.
-
Wonderful templates design to use in business meetings.
-
Excellent products for quick understanding.
-
Top Quality presentations that are easily editable.


