


IT Operations Dashboard For Project Management





Try Before you Buy Download Free Sample Product
 Impress Your
Audience
 100%
Editable
 Save Hours
of Time


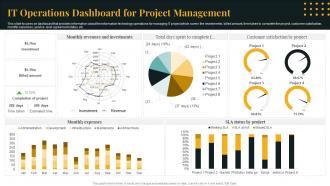
This slide focuses on dashboard that provides information about the information technology operations for managing IT project which covers the investments, billed amount, time taken to complete the project, customer satisfaction, monthly expenses, service level agreement status, etc.
People who downloaded this PowerPoint presentation also viewed the following :
IT Operations Dashboard For Project Management with all 7 slides:
Use our IT Operations Dashboard For Project Management to effectively help you save your valuable time. They are readymade to fit into any presentation structure.






FAQs for IT Operations Dashboard
Key IT operations dashboard metrics include system uptime, response time, CPU and memory utilization, network performance, incident resolution time, and security alerts. These metrics enable IT teams to proactively identify bottlenecks, minimize downtime, and optimize resource allocation, with many organizations finding that comprehensive monitoring ultimately delivers faster issue resolution and enhanced operational efficiency.
Real-time data visualization improves IT decision-making by instantly highlighting system anomalies, performance bottlenecks, and resource utilization patterns across network infrastructure. Through interactive dashboards, IT teams can quickly identify critical issues, allocate resources strategically, and respond to incidents proactively, ultimately reducing downtime and enhancing operational efficiency.
IT operations dashboards streamline incident management by providing real-time visibility, automated alert prioritization, centralized ticket tracking, and performance analytics. These tools enable faster response times, reduce system downtime, and enhance team coordination across departments, with many organizations finding that centralized monitoring ultimately delivers improved service reliability and significantly lower operational costs.
Integrating IT operations dashboards with monitoring tools, ticketing systems, configuration databases, and automation platforms significantly enhances operational efficiency by centralizing data streams and enabling proactive responses. This strategic combination streamlines incident resolution, reduces manual oversight, and delivers comprehensive visibility across infrastructure, with many organizations finding that integrated dashboards ultimately minimize downtime while accelerating service delivery.
Best practices for designing user-friendly IT operations dashboards include prioritizing critical metrics, using intuitive visual hierarchies, implementing real-time data updates, ensuring mobile responsiveness, and customizing views for different roles. These approaches streamline monitoring by reducing cognitive load, accelerating incident response, and enhancing decision-making capabilities, with many IT teams finding that well-designed dashboards significantly improve operational efficiency and minimize system downtime.
Predictive analytics within IT operations dashboards leverages machine learning algorithms, historical data patterns, and real-time monitoring to forecast potential system failures, capacity bottlenecks, and performance degradation before they occur. This proactive approach enables IT teams to schedule preventive maintenance, optimize resource allocation, and minimize costly downtime, with many organizations finding that predictive insights deliver significantly improved system reliability and operational efficiency.
Automation enhances IT operations dashboards by streamlining data collection, enabling real-time monitoring, and facilitating proactive incident response through automated alerts and remediation workflows. These automated capabilities significantly reduce manual oversight requirements while delivering faster resolution times, improved system reliability, and enhanced operational efficiency, with many organizations finding that strategic automation ultimately transforms reactive IT management into predictive, strategic operations.
Dashboard customization involves configuring role-based views, adjusting metric priorities, setting personalized alert thresholds, implementing granular access controls, and creating stakeholder-specific reporting formats. Through modular dashboard design, executives receive high-level performance summaries while technical teams access detailed system metrics, ultimately enabling faster decision-making and improved operational efficiency across organizational levels.
Organizations face challenges including data integration from disparate systems, ensuring real-time accuracy, managing information overload, securing sensitive operational data, and achieving user adoption across teams. While technical complexity can initially overwhelm IT departments, many enterprises find that strategic planning, phased implementation, and comprehensive training ultimately streamline operations and enhance decision-making capabilities.
IT operations dashboards support compliance by providing real-time visibility into system performance, security metrics, audit trails, and regulatory adherence across infrastructure components. These platforms streamline reporting through automated data collection, customizable compliance templates, and historical trend analysis, enabling organizations in healthcare, finance, and government sectors to demonstrate regulatory compliance while reducing manual audit preparation time and enhancing operational transparency.
Mobile compatibility enhances IT operations dashboards by enabling real-time monitoring, instant alert notifications, remote troubleshooting capabilities, and seamless access across devices and locations. Through mobile-optimized interfaces, IT teams can respond to critical incidents faster, maintain system oversight during travel, and coordinate emergency responses more effectively, ultimately delivering improved uptime and operational efficiency.
Current trending technologies in IT operations dashboard development include artificial intelligence and machine learning for predictive analytics, cloud-native architectures for scalability, real-time data streaming platforms, containerization with Kubernetes, and advanced visualization frameworks. These technologies enhance operational efficiency by enabling proactive issue resolution, seamless scalability, and comprehensive system visibility, with many organizations finding that integrated AI-driven dashboards significantly reduce downtime while improving decision-making capabilities.
IT operations dashboards facilitate communication by providing shared visibility into system performance, service availability, and business impact metrics that both teams can understand. These centralized platforms translate technical data into business-relevant insights, enabling IT teams to demonstrate value while helping business stakeholders make informed decisions about resource allocation and strategic priorities.
Risks include incomplete data representation, over-reliance on automated alerts, potential blind spots in complex system interactions, dashboard downtime during critical incidents, and reduced hands-on technical expertise among staff. While dashboards streamline monitoring and enhance operational visibility, organizations increasingly combine them with manual verification processes, multiple monitoring tools, and regular system audits, ultimately delivering more comprehensive oversight and maintaining critical troubleshooting capabilities across their IT infrastructure.
User feedback drives continuous improvement by identifying usability gaps, highlighting missing metrics, and revealing workflow inefficiencies that technical teams might overlook. Through regular surveys, usage analytics, and direct input sessions, organizations can prioritize feature enhancements, streamline navigation, and add relevant KPIs, with many IT departments finding that user-centric iterations significantly enhance operational efficiency and dashboard adoption rates.
-
I didn’t expect such a good service for the money I am paying. But, they exceed my expectations. Great work SlideTeam.
-
Wide collection of templates available. SlideTeam has made it easier to create presentations in just a few minutes.