It value story that matters to business leadership powerpoint presentation slides
It is challenging to communicate the IT value to business stakeholders because tactical indicators and KPIs do not reflect them. This presentation provides solutions to IT businesses. Here is a competently designed template on IT Value Story that Matters to Business Leadership that will be of great use for managers to develop their value statement and supporting KPIs to explain how IT has influenced their actual business results. This presentation aims to identify, measure, and communicate the commercial value of information technology and implement some rules, etc. The template highlights the stakeholders problems and challenges while sharing IT business values. Further, it covers solutions for those problems, strategic planning, rules for representing the business value of IT, etc. The powerful deck also illustrates the implementation of business value for stakeholders, business value drivers, the business value of IT, etc. Lastly, this insightful template includes a collaboration of IT services metrics to business values for communication with stakeholders and business value of IT service metrics and KPIs. Customize this 100 percent editable template. Download it now.
- Google Slides is a new FREE Presentation software from Google.
- All our content is 100% compatible with Google Slides.
- Just download our designs, and upload them to Google Slides and they will work automatically.
- Amaze your audience with SlideTeam and Google Slides.
-
Want Changes to This PPT Slide? Check out our Presentation Design Services
- WideScreen Aspect ratio is becoming a very popular format. When you download this product, the downloaded ZIP will contain this product in both standard and widescreen format.
-

- Some older products that we have may only be in standard format, but they can easily be converted to widescreen.
- To do this, please open the SlideTeam product in Powerpoint, and go to
- Design ( On the top bar) -> Page Setup -> and select "On-screen Show (16:9)” in the drop down for "Slides Sized for".
- The slide or theme will change to widescreen, and all graphics will adjust automatically. You can similarly convert our content to any other desired screen aspect ratio.
Compatible With Google Slides

Get This In WideScreen
You must be logged in to download this presentation.
PowerPoint presentation slides
This complete presentation has PPT slides on wide range of topics highlighting the core areas of your business needs. It has professionally designed templates with relevant visuals and subject driven content. This presentation deck has total of fourty three slides. Get access to the customizable templates. Our designers have created editable templates for your convenience. You can edit the color, text and font size as per your need. You can add or delete the content if required. You are just a click to away to have this ready-made presentation. Click the download button now.
People who downloaded this PowerPoint presentation also viewed the following :
Content of this Powerpoint Presentation
Slide 1: This slide introduces IT Value Story That Matters to Business Leadership. State Your Company Name and begin.
Slide 2: This slide represents Agenda for IT Value Story that Matters to Business Leadership.
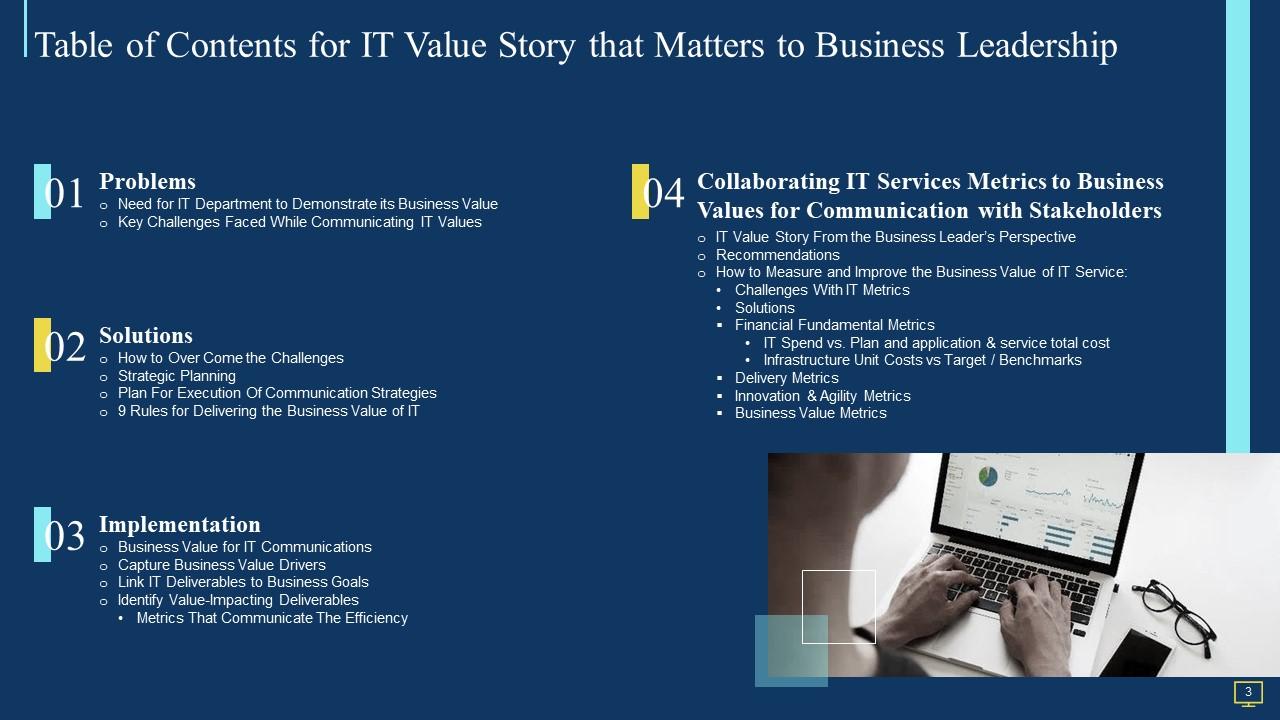
Slide 3: This slide shows Table of Content for the presentation.
Slide 4: This slide shows title for 'Problems'.
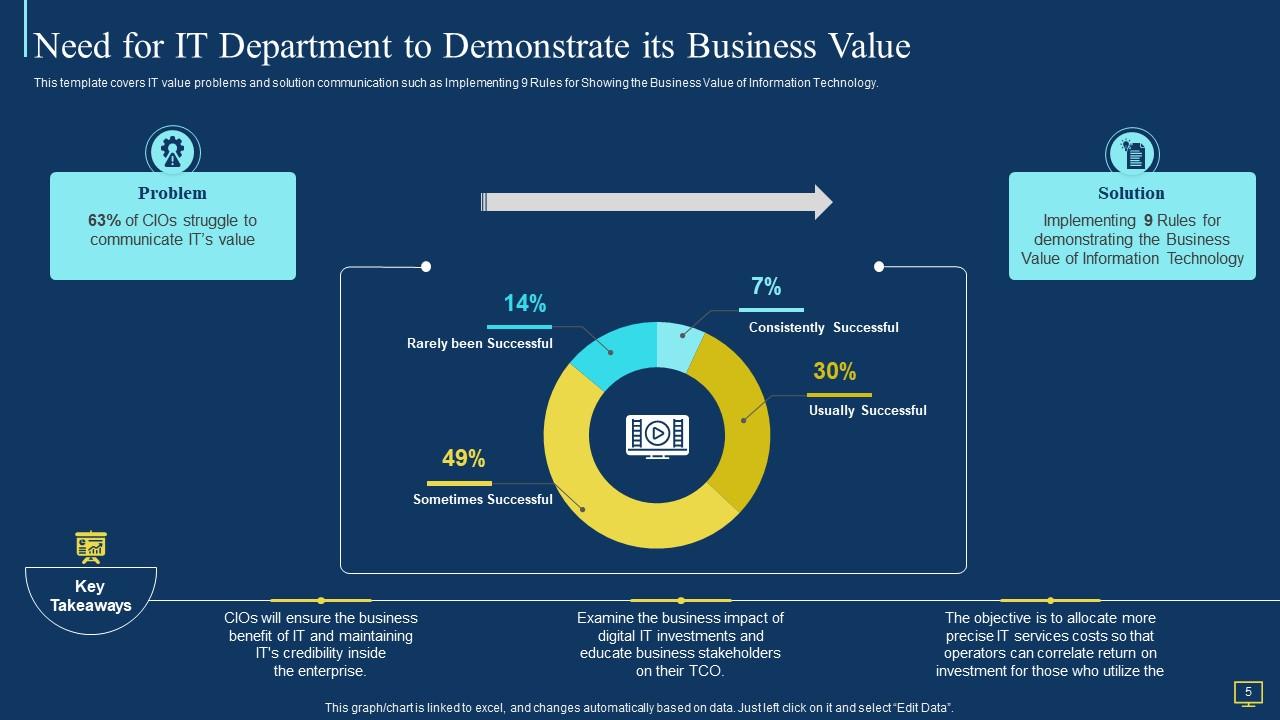
Slide 5: This slide covers IT value problems and solution communication.
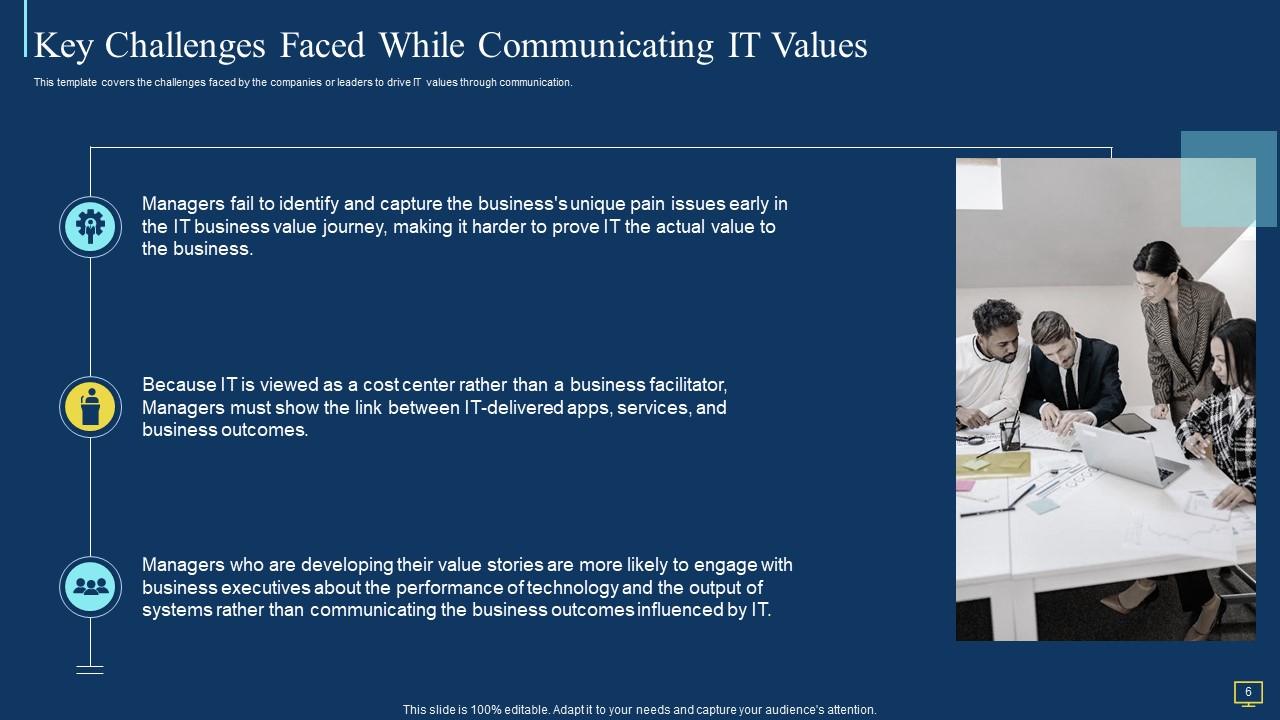
Slide 6: This slide covers the challenges faced by the companies or leaders to drive IT values through communication.
Slide 7: This slide depicts title for 'Solutions'.
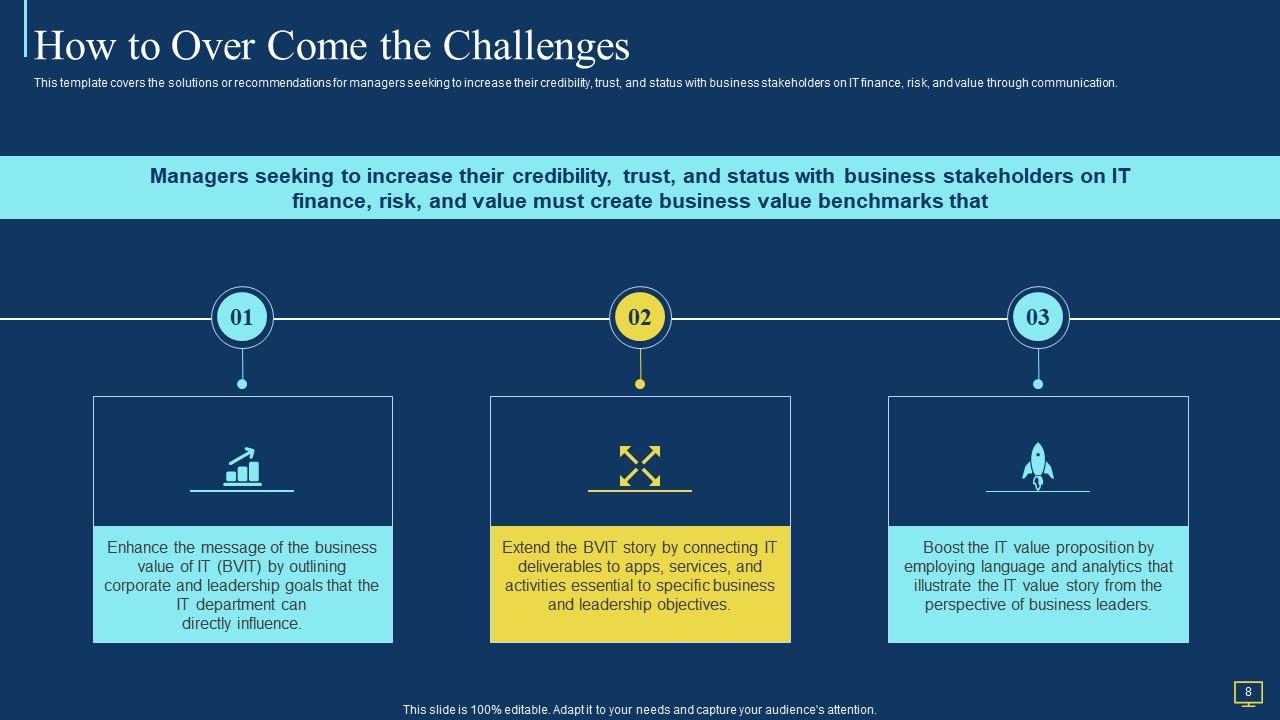
Slide 8: This slide covers the solutions or recommendations for managers seeking to increase their credibility, trust, etc.
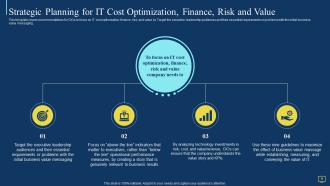
Slide 9: This slide covers recommendations for CIOs to focus on IT cost optimization, finance, etc.
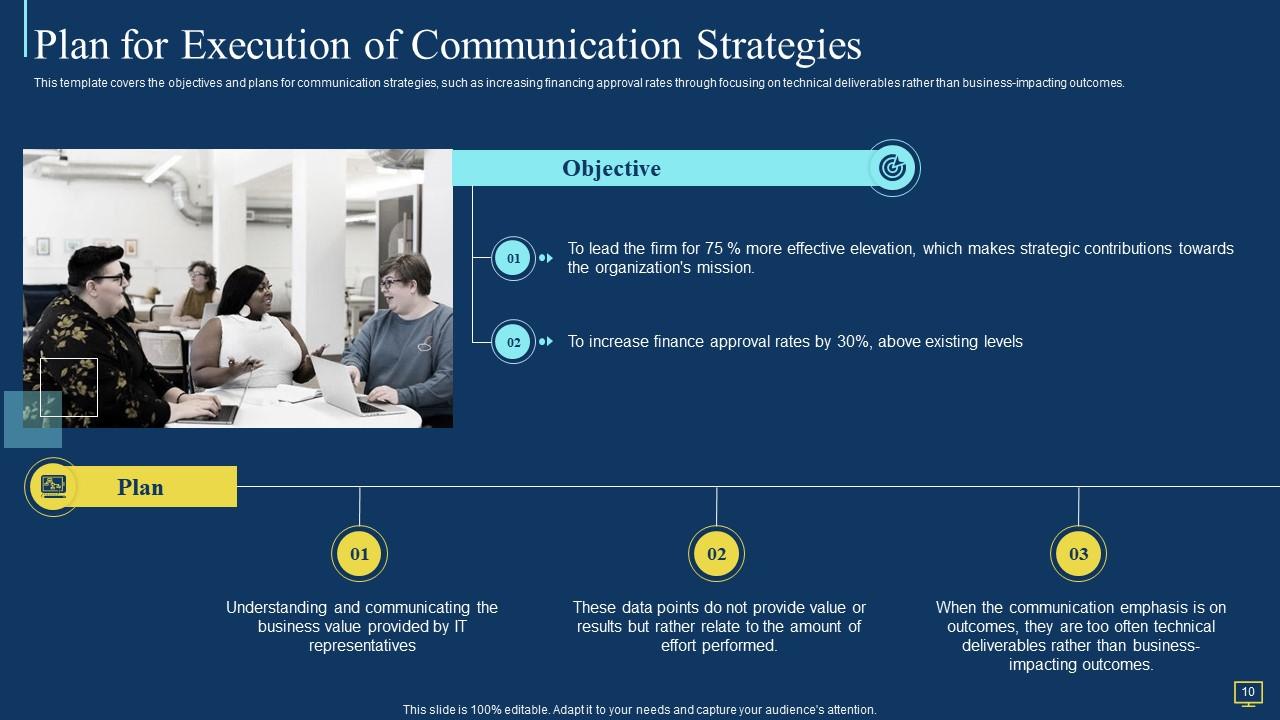
Slide 10: This slide covers the objectives and plans for communication strategies.
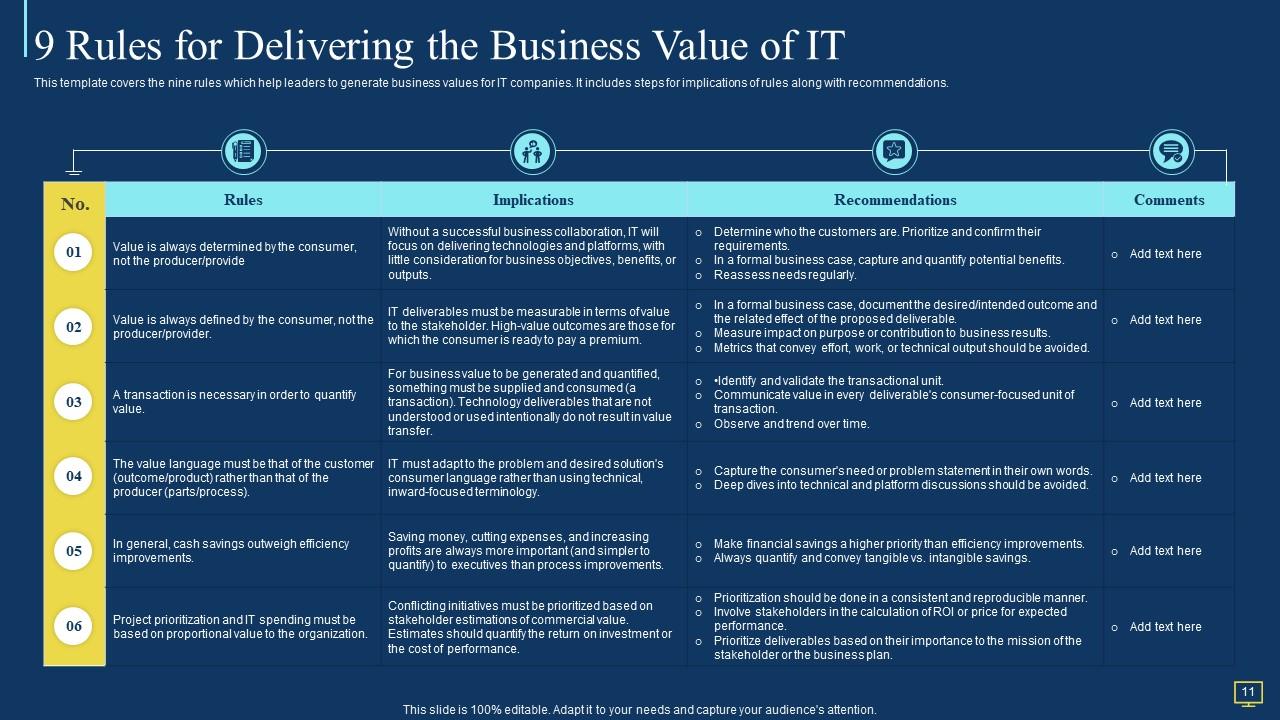
Slide 11: This slide covers the nine rules which help leaders to generate business values for IT companies.
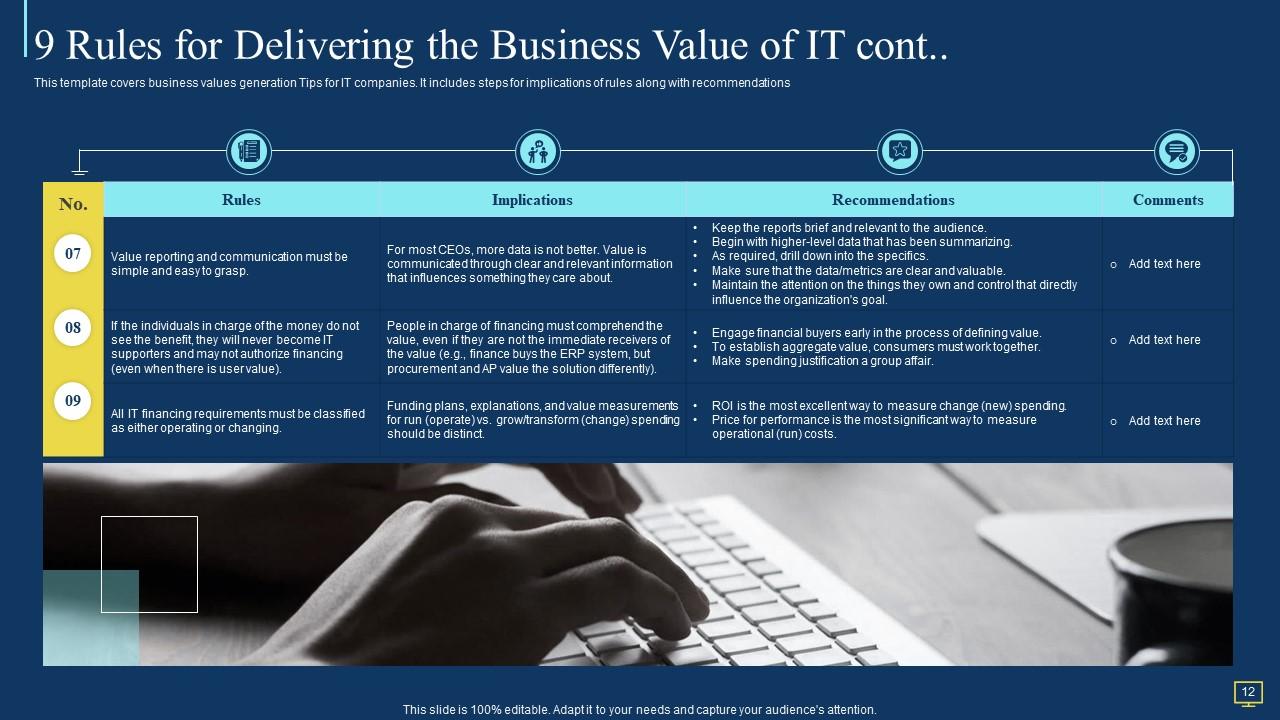
Slide 12: This slide covers business values generation Tips for IT companies.
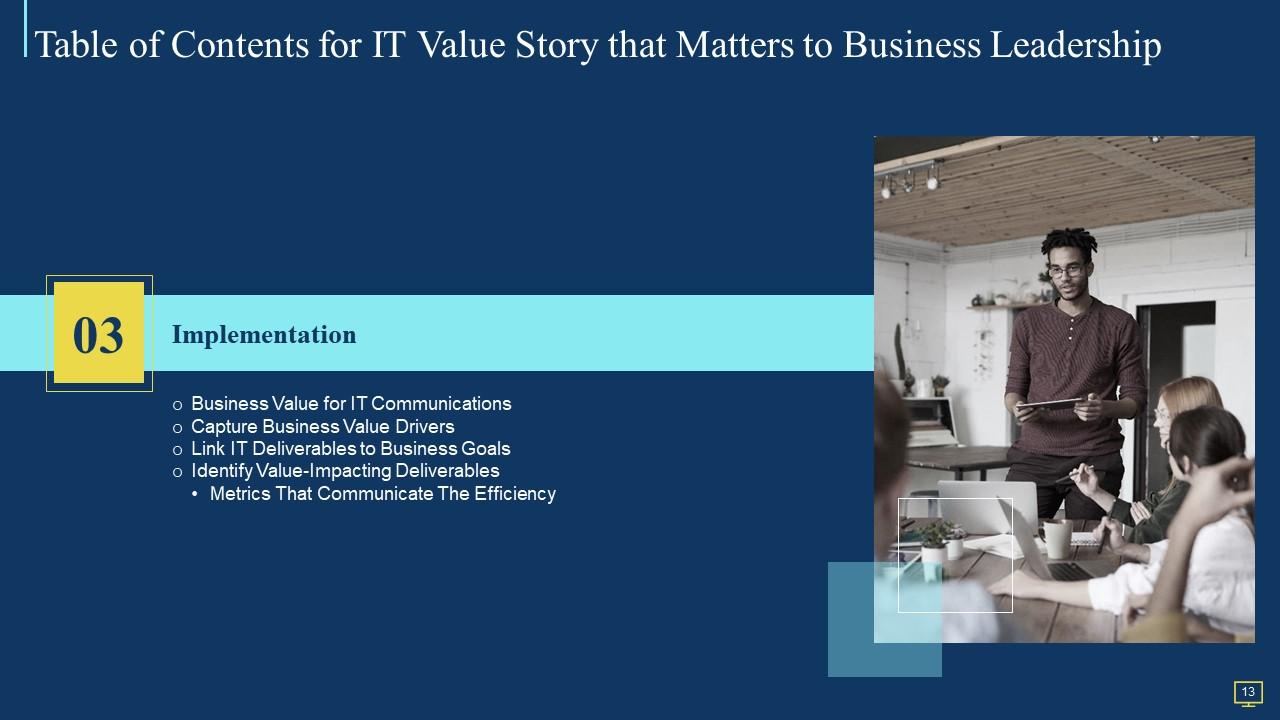
Slide 13: This slide presents title for 'Implementation'.
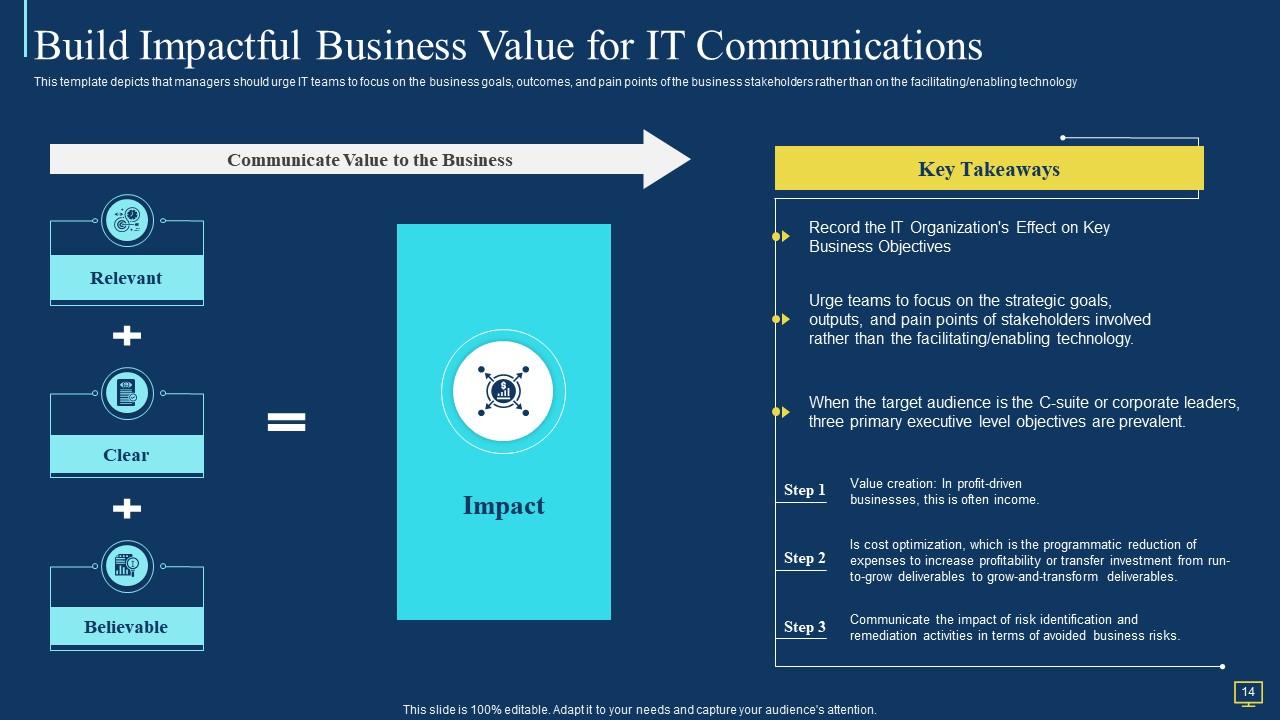
Slide 14: This slide depicts that managers should urge IT teams to focus on the business goals, outcomes, etc.
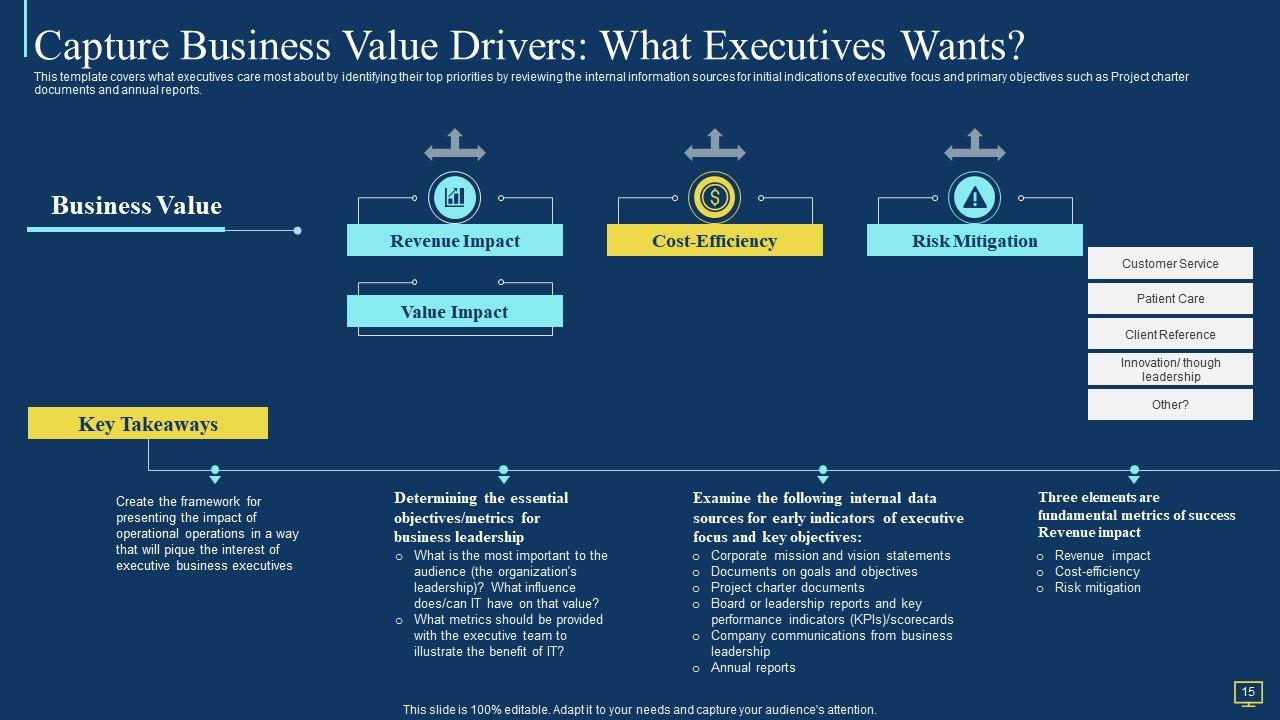
Slide 15: This slide covers what executives care most about by identifying their top priorities.
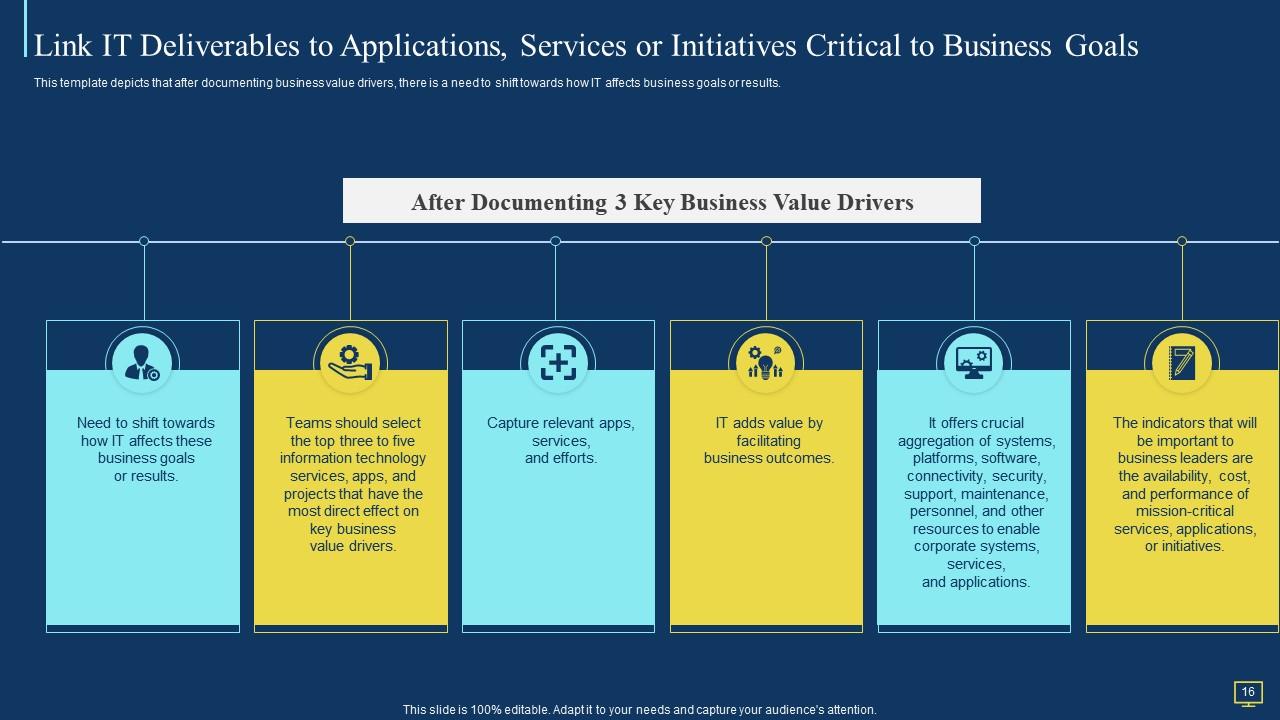
Slide 16: This slide depicts that after documenting business value drivers, there is a need to shift towards how IT affects business goals.
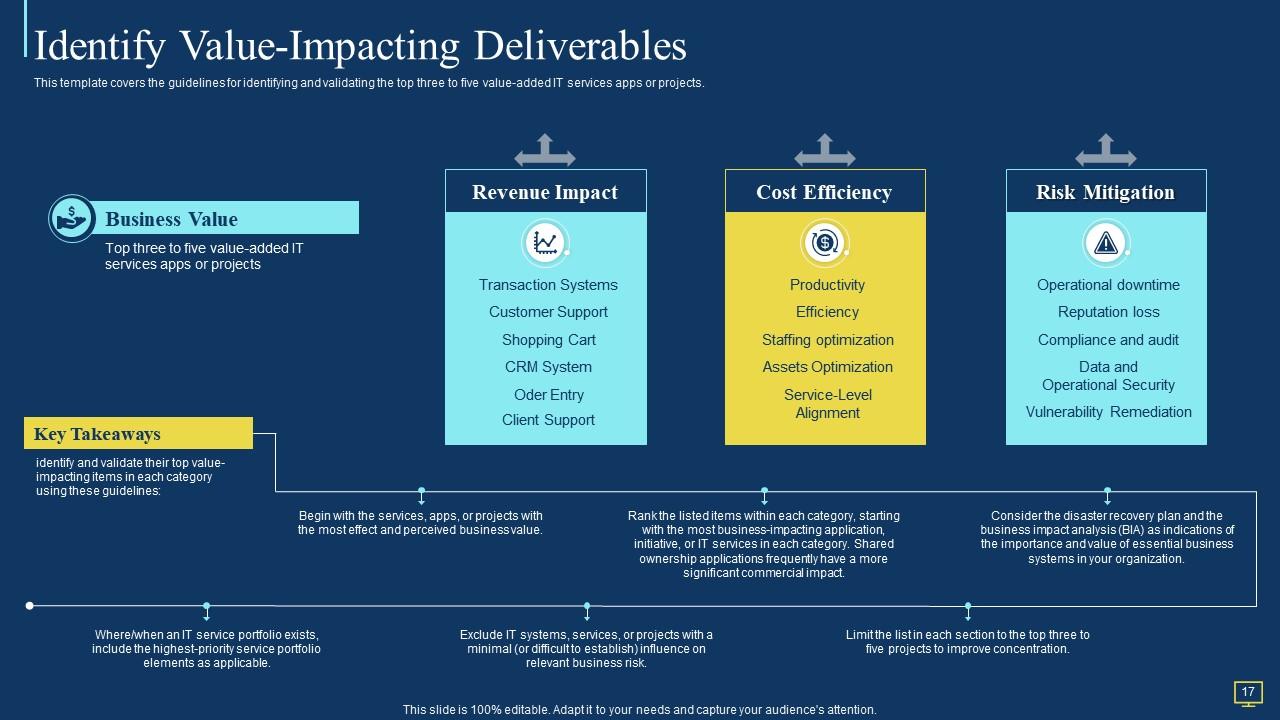
Slide 17: This slide covers the guidelines for identifying and validating the top three to five value-added IT services apps or projects.
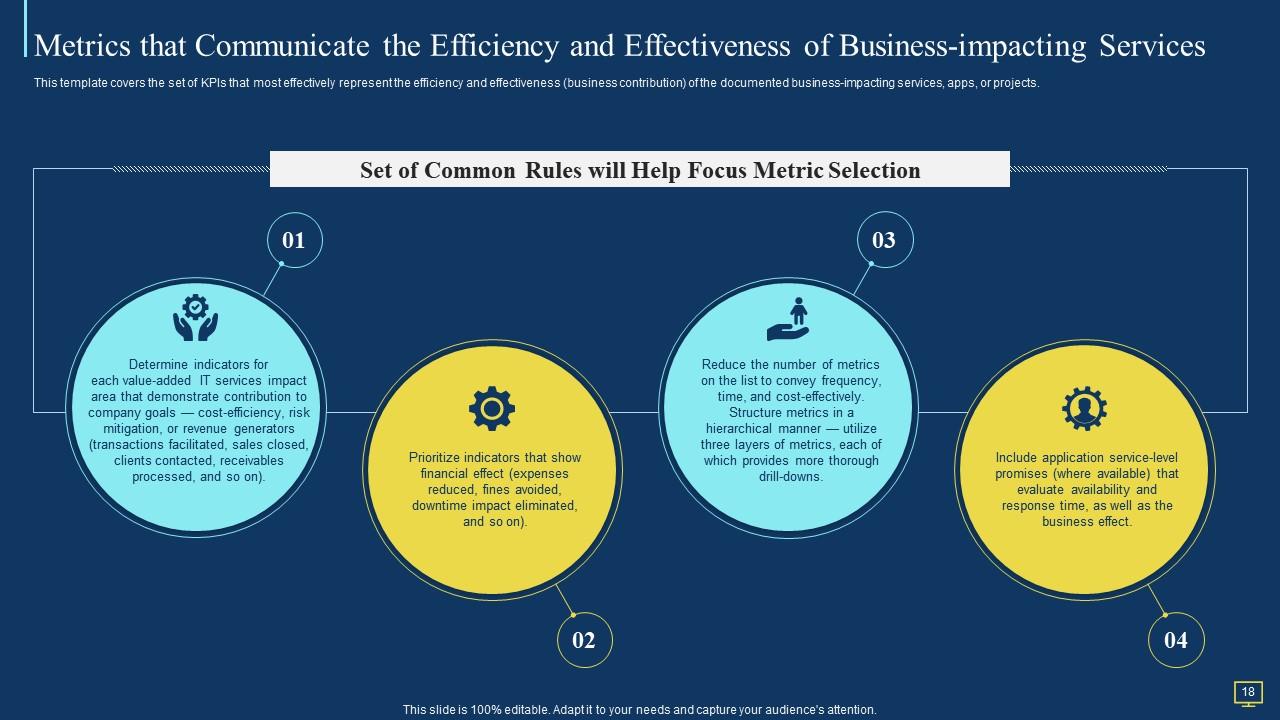
Slide 18: This slide covers the set of KPIs that most effectively represent the efficiency and effectiveness.
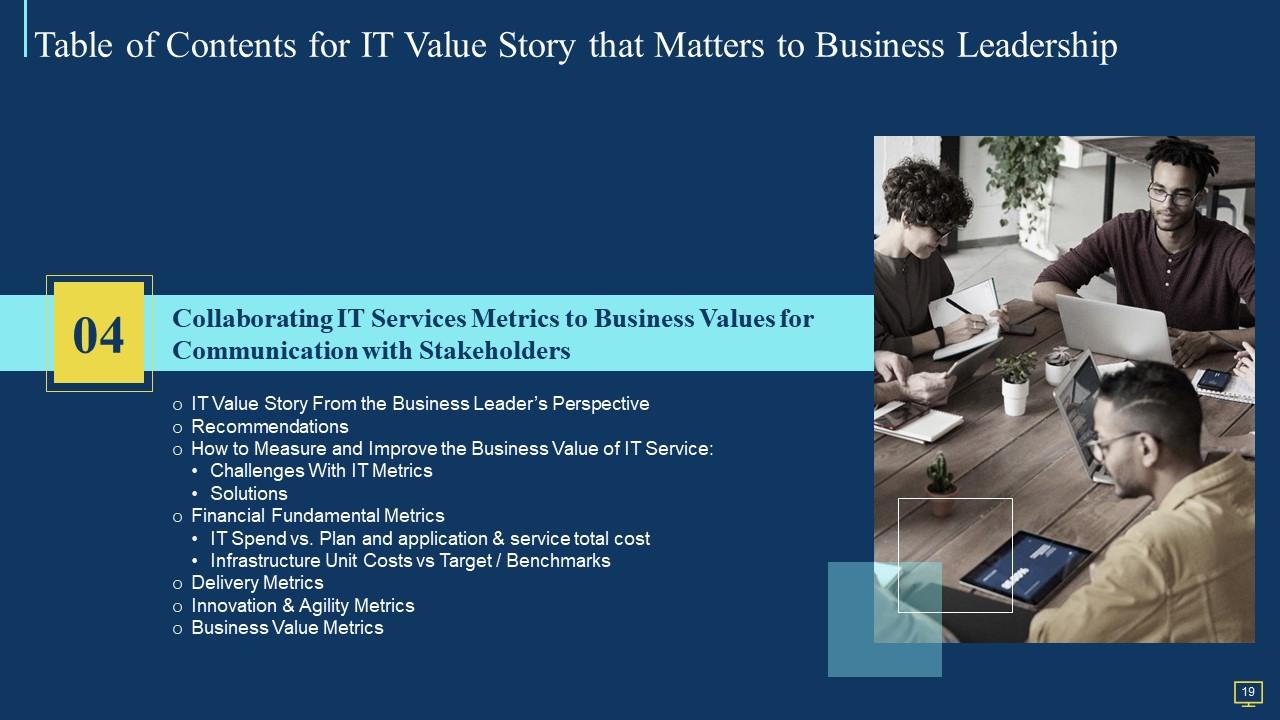
Slide 19: This slide displays title for 'Collaborating IT service metrics to business value'.
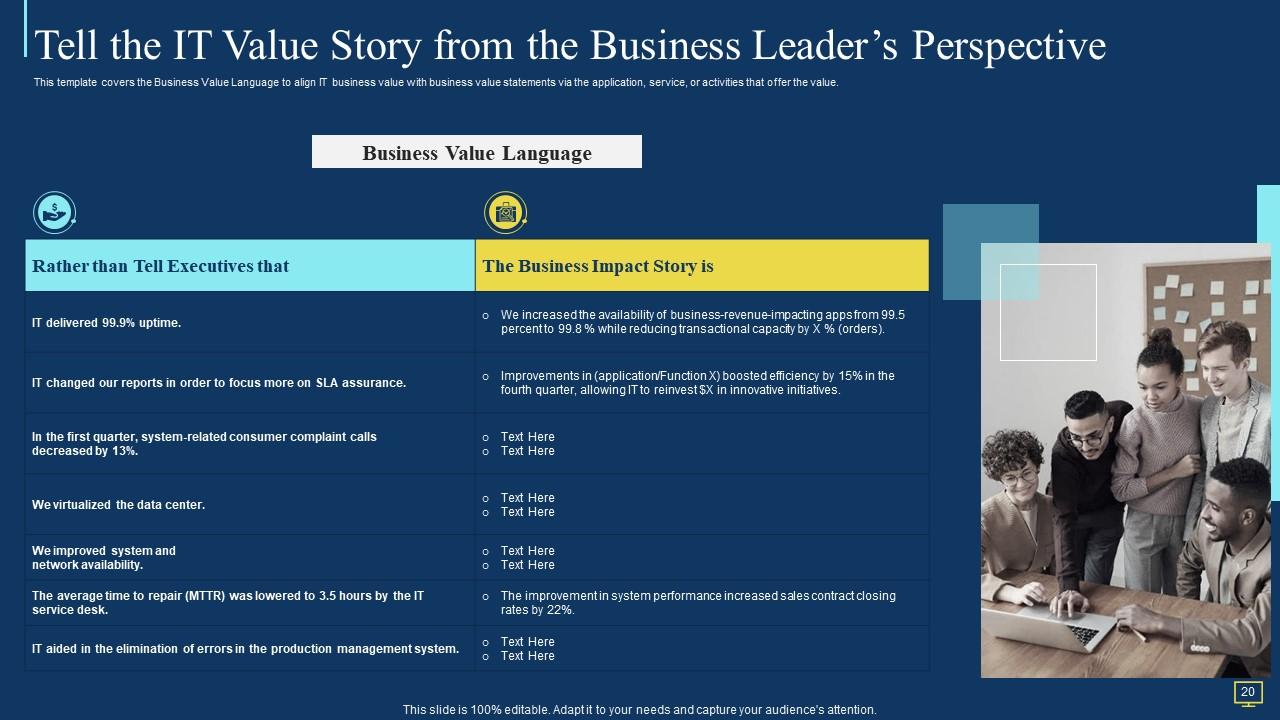
Slide 20: This slide covers the Business Value Language to align IT business value with business value statements.
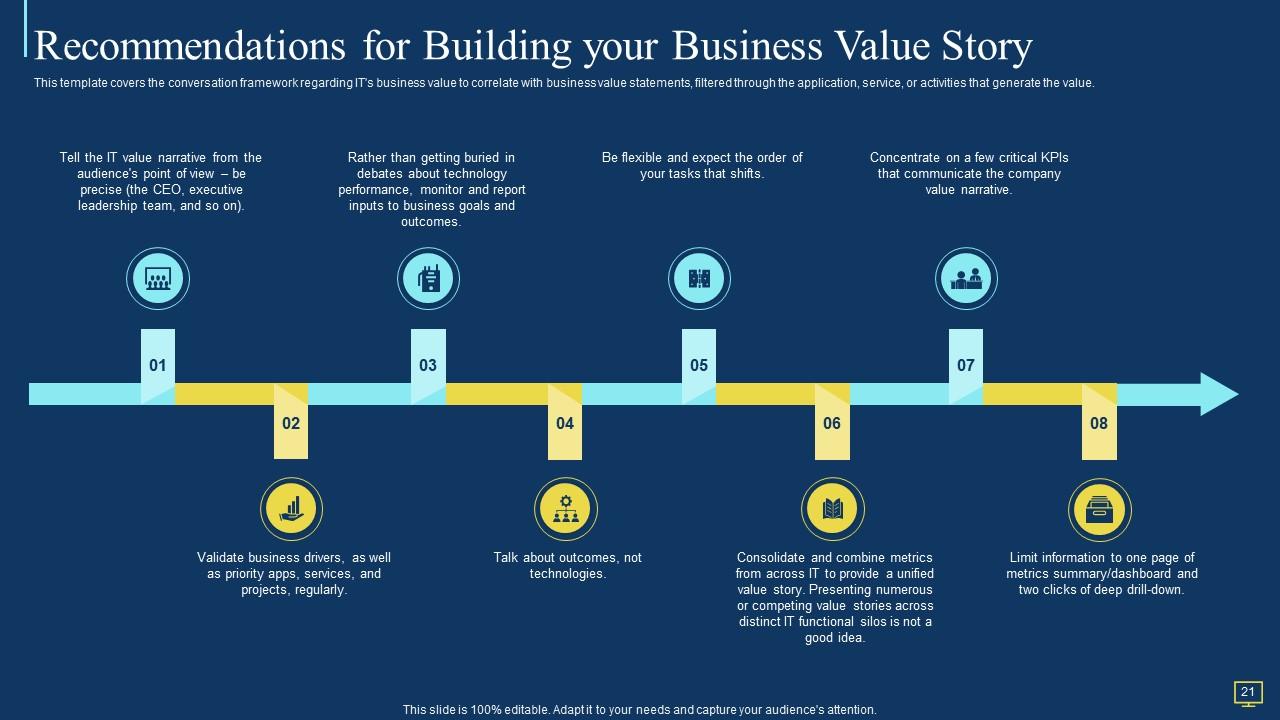
Slide 21: This slide covers the conversation framework regarding IT's business value to correlate with business value statements.
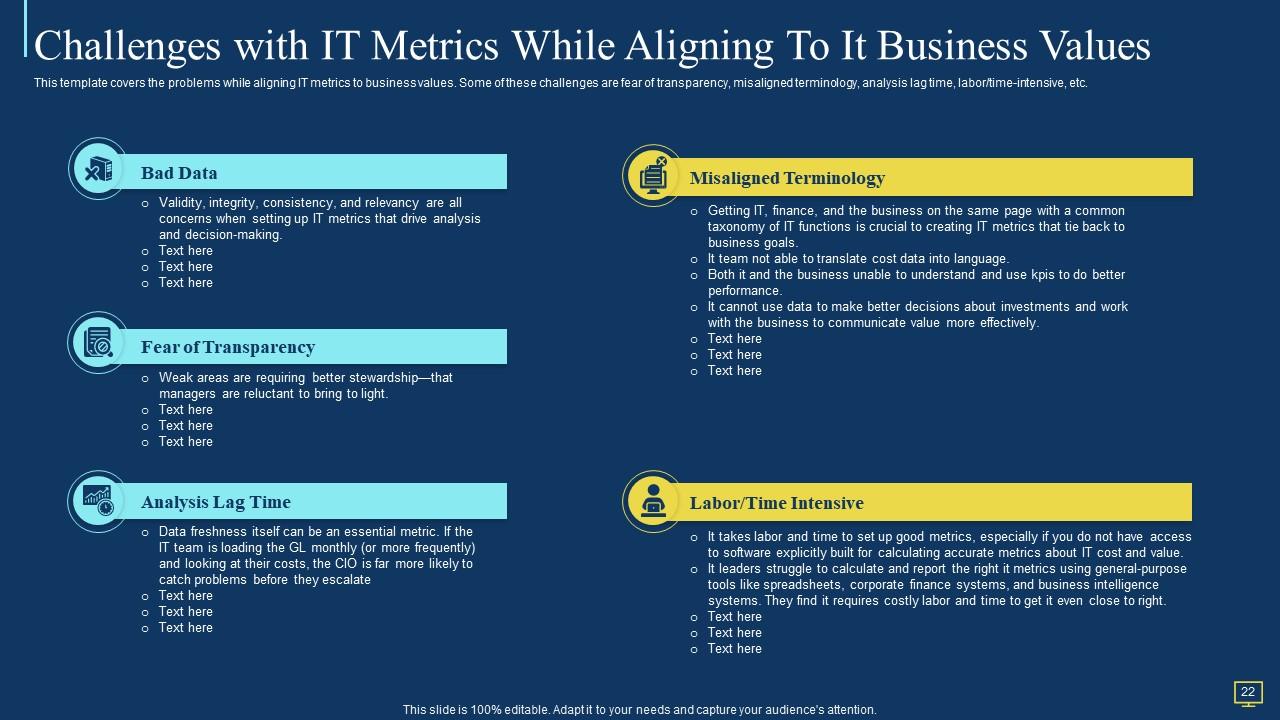
Slide 22: This slide covers the problems while aligning IT metrics to business values.
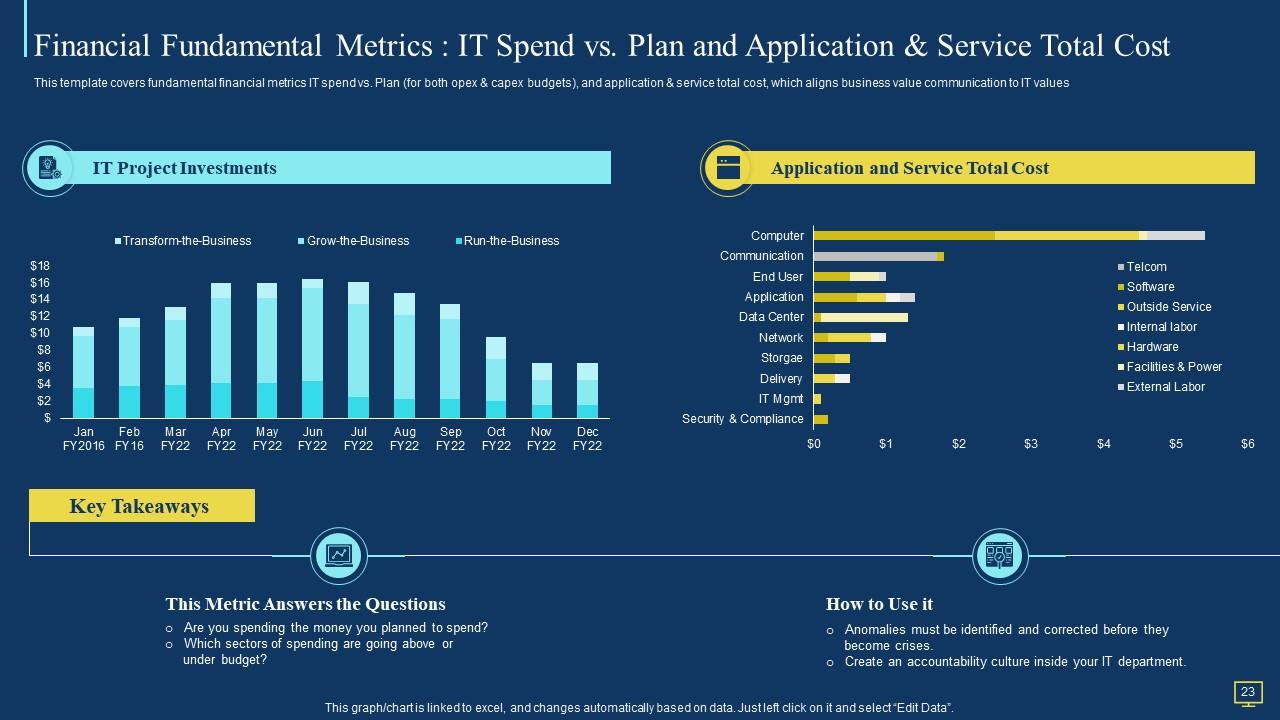
Slide 23: This slide covers fundamental financial metrics IT spend vs. Plan (for both opex & capex budgets).
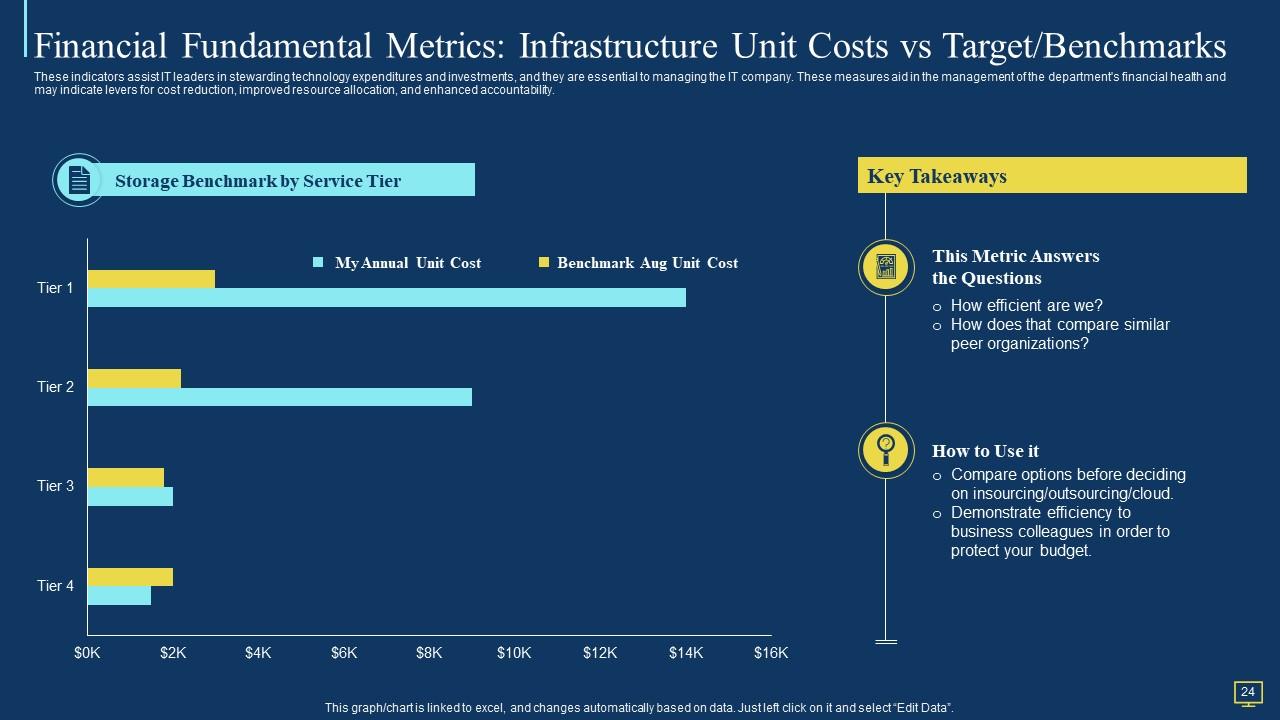
Slide 24: This slide displays Financial Fundamental Metrics: Infrastructure Unit Costs vs Target/Benchmarks.
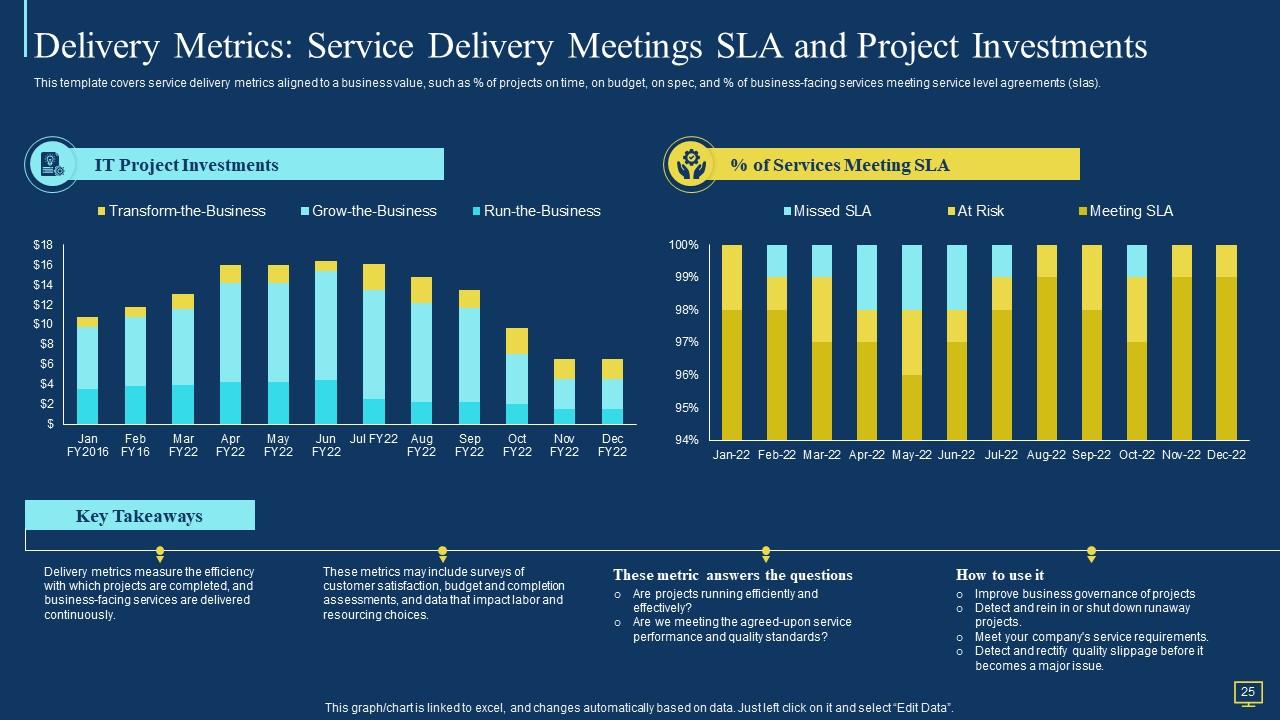
Slide 25: This slide covers service delivery metrics aligned to a business value, such as % of projects on time, etc.
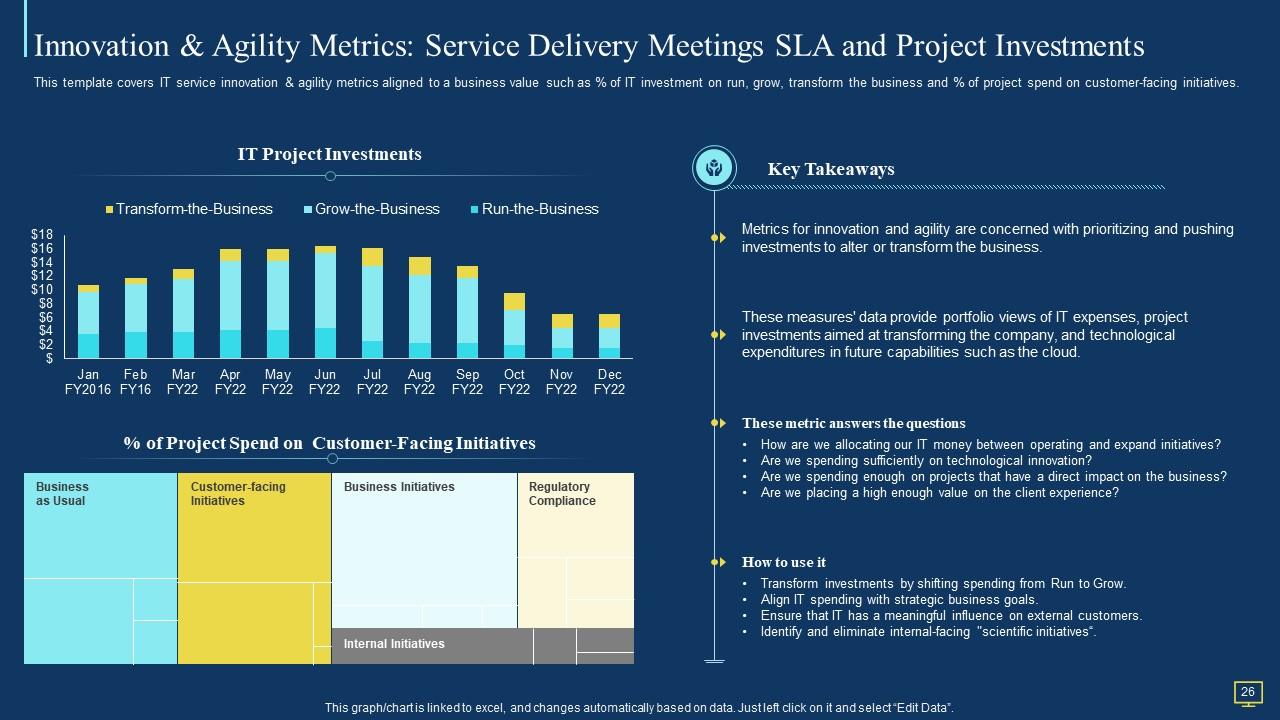
Slide 26: This slide covers IT service innovation & agility metrics aligned to a business value.
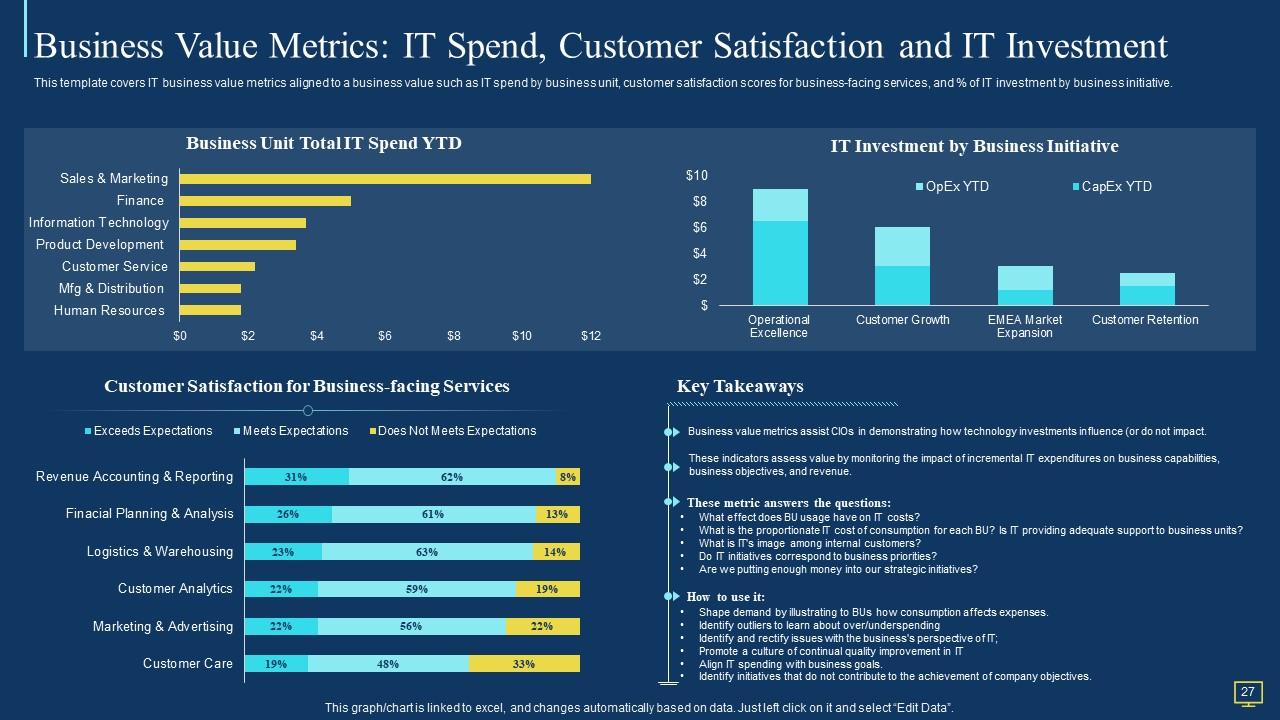
Slide 27: This slide covers IT business value metrics aligned to a business value.
Slide 28: This slide displays Icons for IT Value Story That Matters to Business Leadership.
Slide 29: This slide is titled as Additional Slides for moving forward.
Slide 30: This is About Us slide to show company specifications etc.
Slide 31: This is Our Team slide with names and designation.
Slide 32: This is Our Mission slide with related imagery and text.
Slide 33: This slide shows Post It Notes. Post your important notes here.
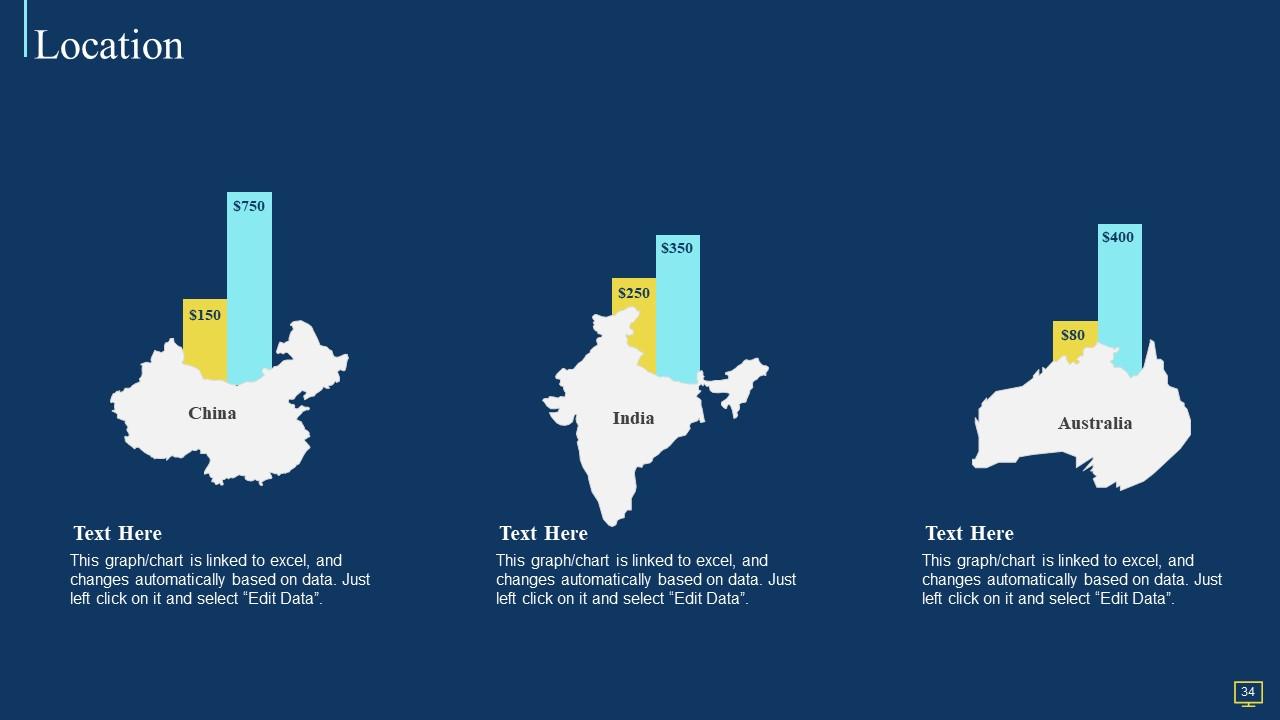
Slide 34: This is a Location slide with maps to show data related with different locations.
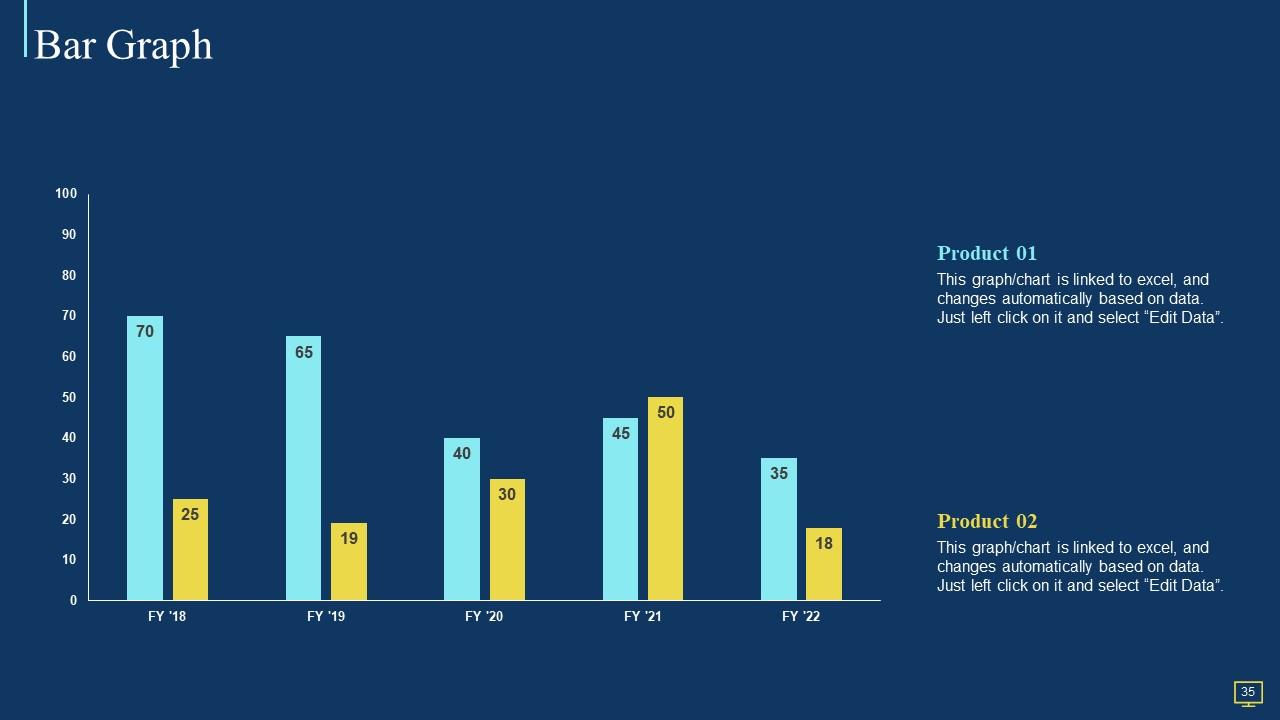
Slide 35: This slide presents Bar chart with two products comparison.
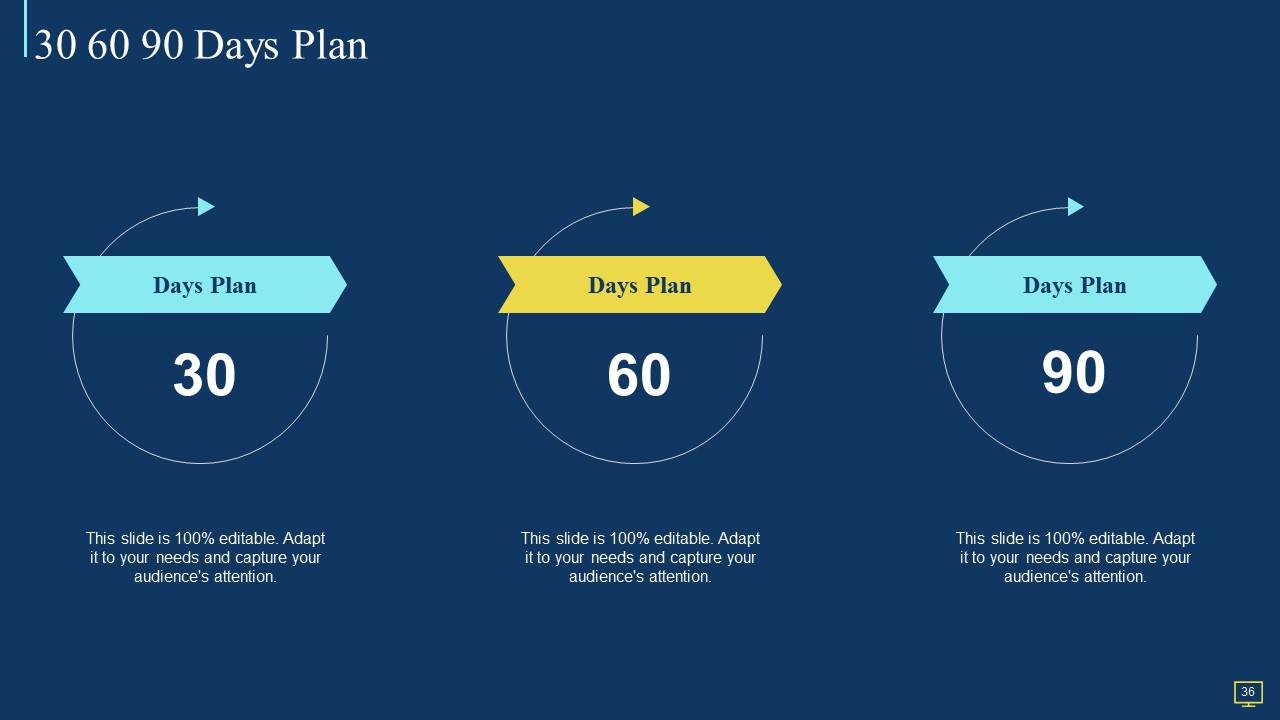
Slide 36: This slide provides 30 60 90 Days Plan with text boxes.
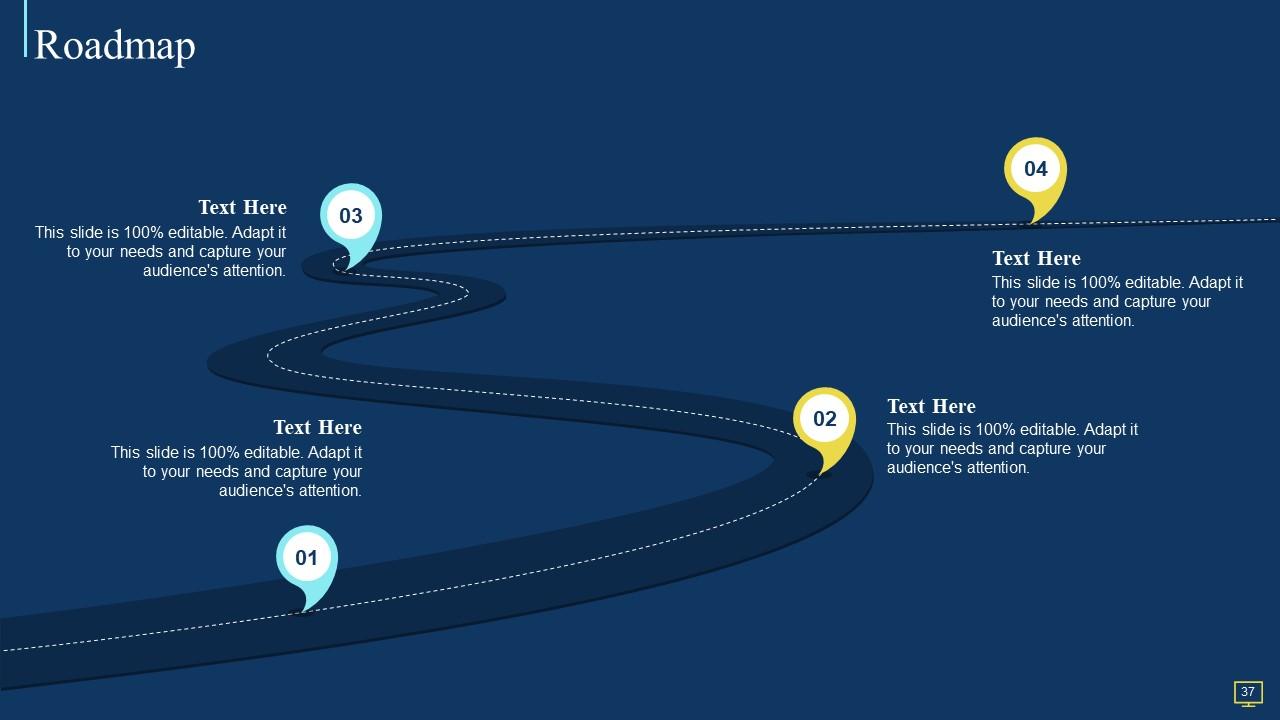
Slide 37: This slide presents Roadmap with additional textboxes.
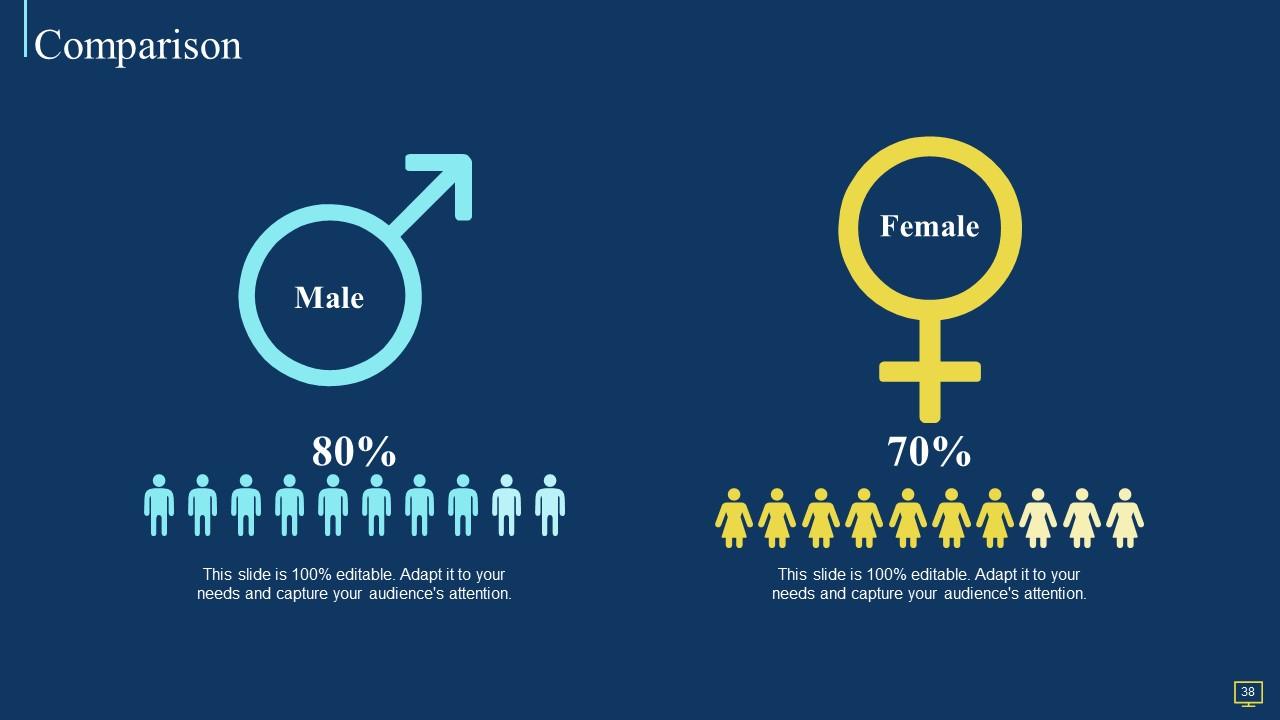
Slide 38: This is a Comparison slide to state comparison between commodities, entities etc.
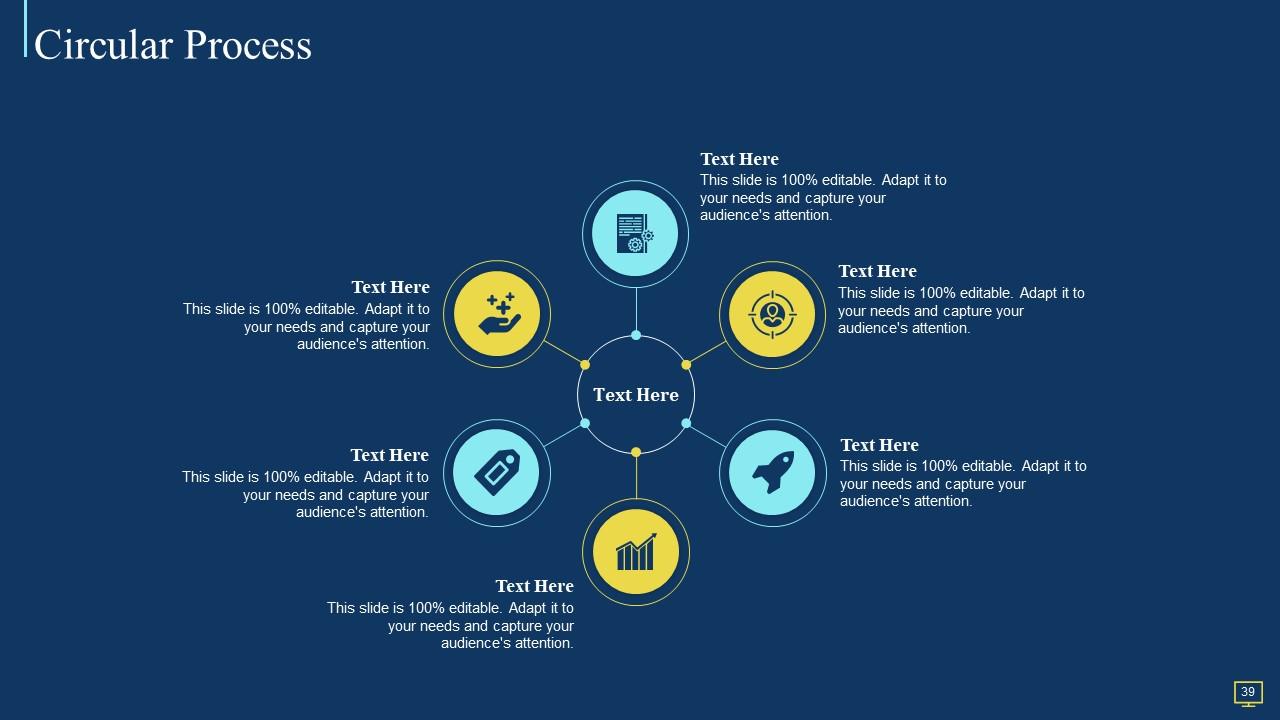
Slide 39: This slide shows Circular Diagram with additional textboxes.
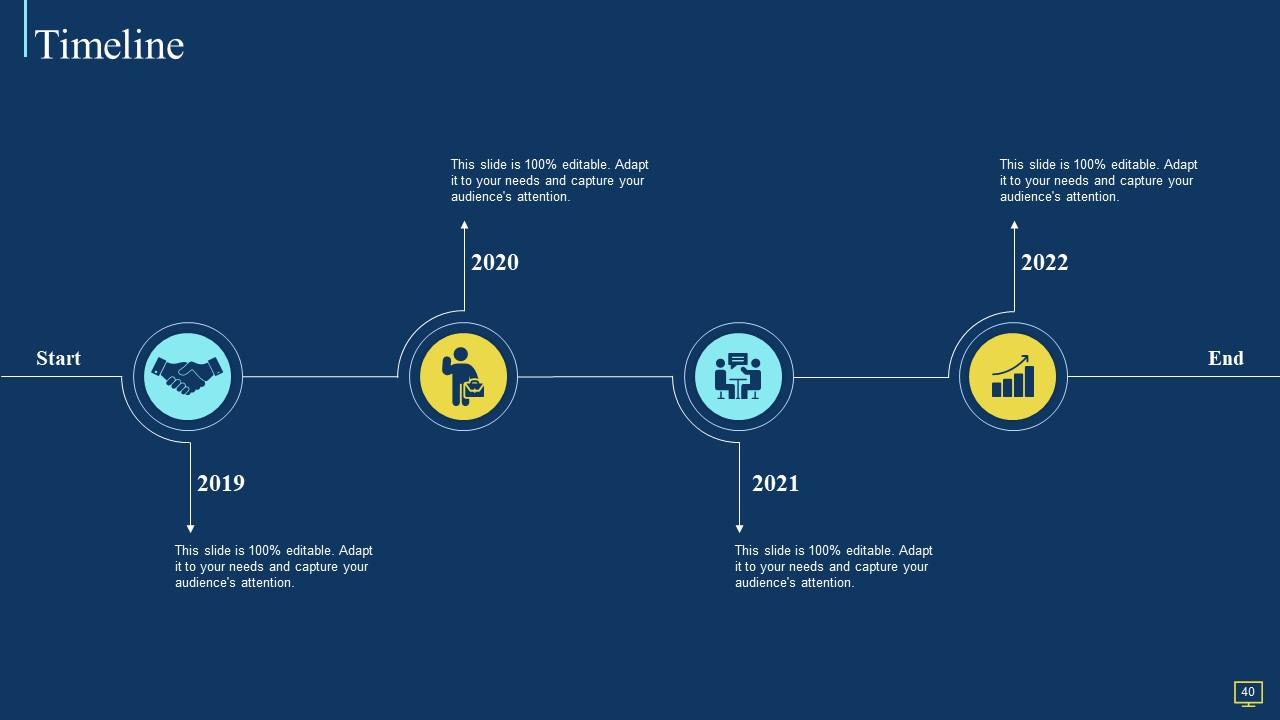
Slide 40: This is a Timeline slide. Show data related to time intervals here.
Slide 41: This slide depicts Venn diagram with text boxes.
Slide 42: This is Our Target slide. State your targets here.
Slide 43: This is a Thank You slide with address, contact numbers and email address.
It value story that matters to business leadership powerpoint presentation slides with all 52 slides:
Use our IT Value Story That Matters To Business Leadership Powerpoint Presentation Slides to effectively help you save your valuable time. They are readymade to fit into any presentation structure.
-
Out of the box and creative design.


