

Essential Key Performance Indicators In Portfolio Summary





Try Before you Buy Download Free Sample Product
 Impress Your
Audience
 100%
Editable
 Save Hours
of Time


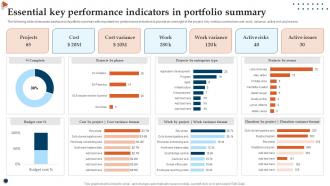
The following slide showcases dashboard of portfolio summary with important key performance indicators to provide an oversight of the project. Key metrics covered are cost, work, variance, active risk and issues.
People who downloaded this PowerPoint presentation also viewed the following :
Essential Key Performance Indicators In Portfolio Summary with all 7 slides:
Use our Essential Key Performance Indicators In Portfolio Summary to effectively help you save your valuable time. They are readymade to fit into any presentation structure.






FAQs for Essential Key Performance Indicators
Look, it really comes down to your business model, but some basics apply everywhere. Revenue growth and profit margins - obvious ones. The big one though? Customer acquisition cost vs lifetime value. Can't tell you how many businesses I've seen tank because they ignored this ratio. Also track retention rates, conversions, and cash flow. Oh and whatever productivity metrics make sense for your industry - that part's pretty specific to what you do. Honestly though, pick 3-5 that actually matter to your main goals. Don't go crazy tracking every possible number.
First figure out what actually moves the needle in your space - like revenue per customer if you're in SaaS, patient satisfaction for healthcare stuff, inventory turnover for retail. Don't just grab some random KPI template online (I've watched that crash and burn so many times). Think about what makes your business tick, then work backwards to find metrics your team can actually control. Oh and here's the thing - more isn't better. Pick maybe 3-5 that really matter and obsess over those instead of tracking everything under the sun. You'll go crazy otherwise.
Think of KPIs as your business GPS - they show you what's actually happening instead of just guessing. You'll spot problems before they get huge and can tell if your strategies are working or totally flopping. Honestly, I've seen too many companies make costly mistakes because they ignored their numbers. Regular check-ins with the right metrics help you pivot when things go sideways. Just don't go overboard picking every possible KPI (been there, it gets messy). Focus on ones that actually matter for your goals and you're golden.
Honestly, quarterly is the bare minimum but it really depends on your industry. Fast-moving business? Check monthly. There's literally nothing more frustrating than chasing metrics that stopped mattering three months ago. Make sure whatever you're tracking actually connects to your current goals - sounds obvious but you'd be surprised how often this gets forgotten. Once a year, do a complete overhaul and question if you're even measuring the right stuff. Oh, and set a calendar reminder right now or you'll never remember to do this consistently.
Oh man, don't do what I did and pick like 10 KPIs - your team will have zero clue what to focus on. Vanity metrics are the worst too (social media likes anyone?). They look cool but mean nothing for actual business results. Pick stuff your team can actually control, otherwise you're just setting everyone up to feel crappy about things they can't change. Unrealistic targets are another killer - nothing makes people more cynical than impossible goals. Honestly, stick to 3-5 that actually matter and check if they still make sense as things change.
So you know how staring at spreadsheets makes your eyes glaze over? Data viz tools fix that by turning all those numbers into actual charts and graphs you can understand instantly. Like, instead of squinting at conversion rates in Excel, you'll see clear trends right away. It's honestly kind of magical - patterns just pop out that you'd never catch otherwise. I always tell people to start simple though, maybe just basic bar charts for your KPIs. Your whole team will get it way faster. Trust me, once you see your data as visuals instead of endless rows, there's no going back.
So leading indicators warn you about what's coming - stuff like website traffic or how full your sales pipeline is. You can actually fix things before they go wrong. Lagging indicators? That's what already happened. Revenue, customer churn, whatever. It's like your GPS warning about traffic vs already being stuck in it (which sucks). Most teams obsess over the lagging stuff and totally miss the warning signs - drives me crazy. Both matter, but honestly? Find 2-3 leading indicators that actually predict your big outcomes. Way more useful.
Here's the thing - you've actually got a major edge over big companies with KPIs. They get stuck in endless meetings while you can spot problems in your data and fix them within days. Honestly, that's where smaller businesses crush it. Don't make the mistake of tracking a million different things though. Stick to maybe 3-5 metrics that actually move the needle for your customers and revenue. Big corporations waste so much time and money trying to measure everything. You can be way smarter about it and make decisions fast.
Honestly, you don't need to overthink this. Start with NPS and CSAT - they're the gold standard for a reason. Customer Effort Score is solid too if you want a third one. For engagement stuff, I'd look at repeat purchases and how much time people spend on your site. Support tickets can tell you a lot too, though nobody really wants to dig into those numbers. Monthly active users is fine but kinda feels like a vanity metric half the time. Don't try tracking everything at once - you'll just confuse yourself. Pick 3-4 that actually move the needle for your business.
So here's the thing - KPIs work because they make it impossible to hide. Each person picks 2-3 metrics they actually control (not some team-wide BS where everyone can just coast). Suddenly there's no more "it wasn't my fault" when stuff hits the fan. You can see exactly who's doing what in real-time. The trick is weekly check-ins to go over progress together and figure out what's blocking people. Honestly, it sounds harsh but it's way better than the alternative of nobody knowing what anyone's supposed to be doing.
Honestly, I'd skip the usual productivity stuff and focus on "collaboration impact" - like how often other people actually build on someone's work or cite it in meetings. Learning velocity is solid too - just track what new skills or certs people pick up. My favorite though? Problem-solving speed. See how fast your team tackles roadblocks instead of just passing them up the chain. Cross-functional engagement shows who's breaking out of their silos (super telling), and innovation contributions count the ideas people submit or improvements they push through. Pick one or two that fit your goals and test them out for a quarter. Way better than just counting output.
Oh man, this is huge. Japanese teams care way more about long-term stability stuff, while your US folks probably want those individual performance numbers. Different cultures view success totally differently - like collectivist ones respond better to team KPIs instead of solo metrics. Honestly, the smartest thing? Just ask each regional team what success actually looks like to them first. You'll save yourself so much headache later. Business practices vary wildly too, plus how people communicate failures and wins. Trust me, getting that local input upfront makes everything smoother.
First thing - automate your data collection so you're not doing manual entry that's bound to have typos. I'd set up validation checks too, like comparing against historical trends or other systems. Can't tell you how many times I've seen people using outdated spreadsheets from like 3 months ago... anyway. Make sure someone owns each data point and has another person double-check the important stuff before reports go out. Your team should actually understand what the KPIs mean so they'll spot weird numbers. Start with auditing what you've got this week.
Just grab data straight from your systems instead of typing everything manually - saves so much time and cuts out those annoying mistakes. Start with your most important KPIs first. Don't try to do everything at once or you'll go crazy. Dashboards that auto-refresh are pretty sweet, plus you can schedule reports to send themselves. Power BI and Tableau are solid choices, though honestly even Excel works if you set up some basic automation. Once it's running, you'll wonder why you waited so long. Real-time charts that update themselves? Chef's kiss.
Tell the story behind your data, not just the numbers. Dashboards and simple charts work way better than those awful PowerPoint decks that are basically Excel with better colors. What changed? Why should anyone care? What's your plan? Match your audience too - execs want big picture stuff while your team leads need the nitty-gritty details. Oh, and always end with actual next steps. I can't tell you how many meetings I've sat through where people just... present numbers and then awkwardly stare at each other. Context is everything.
-
The PPTs are extremely simple to modify. Thank you for providing the slides that are ready to be used. They assist me in saving a lot of time.
-
The templates are handy and I can personalize them as per my needs. Glad to be your subscriber!