

KPI Dashboard For Tracking Supply Chain Costs Industry Overview Of Food





Try Before you Buy Download Free Sample Product
 Impress Your
Audience
 100%
Editable
 Save Hours
of Time


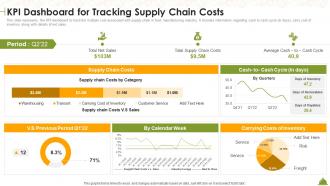
This slide represents the KPI dashboard to track the multiple cost associated with supply chain in food manufacturing industry. It includes information regarding cash to cash cycle in days, carry cost of inventory along with details of net sales.
People who downloaded this PowerPoint presentation also viewed the following :
KPI Dashboard For Tracking Supply Chain Costs Industry Overview Of Food with all 7 slides:
Use our KPI Dashboard For Tracking Supply Chain Costs Industry Overview Of Food to effectively help you save your valuable time. They are readymade to fit into any presentation structure.






FAQs for KPI Dashboard For Tracking Supply Chain Costs Industry
Effective KPI dashboard components include real-time data visualization, customizable metrics display, drill-down capabilities, automated alerts, and mobile accessibility. These elements streamline performance monitoring by delivering instant insights, enabling quick decision-making, and providing stakeholders with relevant information, with many organizations finding that well-designed dashboards enhance operational efficiency and strategic alignment.
KPI dashboards can be tailored through industry-specific metrics, customized visualizations, relevant benchmarking data, and sector-appropriate alerts and automation features. Healthcare organizations focus on patient outcomes and operational efficiency, while retail companies emphasize sales performance and inventory turnover, with financial services prioritizing risk management and regulatory compliance, ultimately delivering targeted insights that drive strategic decision-making.
Data visualization transforms KPI dashboards by converting complex metrics into intuitive charts, graphs, heat maps, and trend lines that enable instant comprehension and pattern recognition. Through strategic visual elements, executives and managers can quickly identify performance gaps, spot emerging trends, and make data-driven decisions faster, ultimately delivering improved operational efficiency and competitive advantage.
Popular KPI dashboard tools include Tableau, Power BI, Google Data Studio, Looker, and Qlik Sense. These platforms streamline data visualization by automating report generation, enabling real-time monitoring, and providing customizable templates, with many organizations finding that integrated dashboards enhance decision-making speed and operational transparency across departments.
Organizations ensure KPI dashboard data accuracy through automated data validation, real-time integration with source systems, regular data audits, and establishing clear data governance protocols. These practices streamline data quality by eliminating manual errors, standardizing metrics definitions, and implementing approval workflows, with many companies finding that consistent monitoring ultimately delivers reliable insights and enhanced decision-making capabilities.
Best practices for selecting KPIs include focusing on strategic alignment, ensuring measurability and actionability, limiting the number to avoid information overload, and tailoring metrics to specific audience needs. These practices streamline decision-making by emphasizing outcome-based indicators, real-time accessibility, and clear performance thresholds, with many organizations finding that targeted dashboards enhance operational efficiency and accelerate strategic responses.
Real-time data integration enhances KPI dashboards by delivering immediate insights, eliminating data lag, and enabling rapid decision-making across organizational levels. Through automated data feeds, companies in manufacturing, retail, and financial services can identify trends, respond to performance fluctuations, and optimize operations instantly, ultimately gaining competitive advantage through faster, more informed strategic responses.
Common KPI dashboard mistakes include overcrowding with too many metrics, using inappropriate visualizations, lacking clear data hierarchy, ignoring mobile responsiveness, and failing to align with user needs. These design flaws often result in decision paralysis and reduced adoption rates, with many organizations finding that simplified, role-specific dashboards deliver significantly better user engagement and actionable insights.
KPI dashboards benefit different stakeholders by providing role-specific insights that enhance decision-making across organizational levels. Executives gain strategic oversight through high-level performance metrics, managers streamline operational monitoring and resource allocation, while front-line employees track individual contributions and goals, ultimately delivering improved accountability, faster response times, and enhanced organizational alignment.
Customer satisfaction KPI dashboards should track Net Promoter Score (NPS), Customer Satisfaction Score (CSAT), Customer Effort Score (CES), first-call resolution rates, and average response times. These metrics enable organizations to identify service gaps, streamline customer interactions, and enhance overall experiences, with many retail and financial services companies finding that comprehensive satisfaction tracking ultimately delivers improved retention and competitive advantage.
KPI dashboards facilitate decision-making by providing real-time visibility into performance metrics, trend analysis, and operational insights that enable leaders to identify opportunities and address challenges quickly. These strategic tools streamline planning processes by consolidating data from multiple sources, with organizations like retail chains and financial institutions finding that centralized performance tracking ultimately delivers faster strategic pivots and improved competitive positioning.
Adaptability and scalability in KPI dashboards ensure they evolve with changing business needs, accommodate growing data volumes, and support organizational expansion across departments and markets. These capabilities enable companies to integrate new metrics, handle increased user loads, and maintain performance consistency, with many enterprises finding that flexible dashboards deliver sustained competitive advantage and operational efficiency as business requirements evolve.
User experience design enhances collaboration through KPI dashboards by creating intuitive interfaces, enabling real-time data sharing, and facilitating cross-functional communication. Through streamlined visualizations and interactive features, teams can quickly identify trends, discuss performance metrics, and align on strategic priorities, ultimately delivering faster decision-making and improved organizational transparency.
Automated alerts and notifications serve as proactive monitoring systems within KPI dashboards, enabling real-time detection of performance deviations, threshold breaches, and critical business events. These features streamline decision-making by instantly notifying relevant stakeholders when metrics require attention, ultimately reducing response times and preventing minor issues from escalating into significant operational challenges.
Social media metrics can be effectively incorporated into KPI dashboards by integrating engagement rates, reach analytics, conversion tracking, brand sentiment scores, and follower growth data alongside traditional business metrics. These platforms enable marketing teams to monitor campaign performance, measure ROI, and align social initiatives with broader business objectives, while many organizations find that combining social metrics with sales data delivers comprehensive insights into customer journey effectiveness and competitive positioning.
-
Making a presentation has never been this easy for me. Thank you SlideTeam for offering a splendid template library.
-
I was confident and well prepared for my presentation for the first time ever. With SlideTeam’s templates, I could deliver one of my best presentations. Will be coming back for more!