


KPI Dashboard To Analyze In Store Merchandising Strategy Performance Increasing Brand Loyalty




Try Before you Buy Download Free Sample Product
 Impress Your
 Audience
 100%
100% Editable
 Save Hours
 of Time


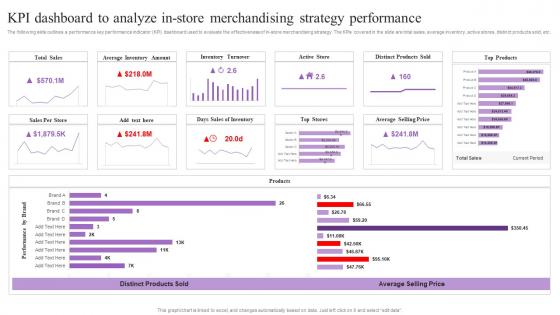
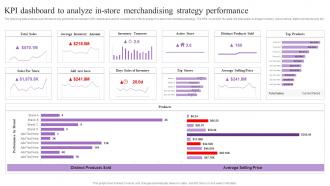
The following slide outlines a performance key performance indicator KPI dashboard used to evaluate the effectiveness of in-store merchandising strategy. The KPIs covered in the slide are total sales, average inventory, active stores, distinct products sold, etc.
People who downloaded this PowerPoint presentation also viewed the following :
KPI Dashboard To Analyze In Store Merchandising Strategy Performance Increasing Brand Loyalty with all 7 slides:
Use our KPI Dashboard To Analyze In Store Merchandising Strategy Performance Increasing Brand Loyalty to effectively help you save your valuable time. They are readymade to fit into any presentation structure.





FAQs for KPI Dashboard To Analyze In Store Merchandising Strategy Performance
Essential KPIs for business monitoring dashboards include revenue growth, customer acquisition cost, conversion rates, operational efficiency metrics, and employee productivity indicators. These metrics enable organizations to track performance across sales, marketing, operations, and human resources simultaneously, with many companies finding that combining financial, operational, and customer-focused KPIs delivers comprehensive insights and competitive advantage.
Visual elements enhance KPI dashboard clarity through color coding, charts, graphs, icons, and interactive filters that immediately communicate performance status and trends. These design components streamline data interpretation by highlighting critical metrics, enabling quick identification of areas requiring attention, and ultimately delivering faster decision-making capabilities for management teams.
Best practices for designing engaging KPI dashboards include clear visual hierarchy, relevant metric selection, real-time data integration, intuitive navigation, and mobile responsiveness. These design principles streamline decision-making by minimizing cognitive load, highlighting critical performance indicators, and enabling quick drill-down capabilities, with many organizations finding that well-designed dashboards ultimately enhance operational efficiency and strategic alignment.
KPI dashboards should be updated based on business needs and data velocity, with real-time updates for operational metrics, daily updates for sales and customer data, and weekly or monthly updates for strategic performance indicators. Financial services and retail often require hourly updates for customer interactions, while manufacturing typically updates daily production metrics, ultimately ensuring decision-makers have timely, actionable insights without overwhelming users with excessive data refreshes.
Recommended KPI dashboard tools include Tableau, Power BI, Google Data Studio, Klipfolio, and Sisense, each offering unique visualization capabilities and integration options. These platforms streamline data collection, automate reporting processes, and enable real-time monitoring, with many organizations finding that cloud-based solutions like Power BI and Data Studio deliver faster implementation and enhanced collaborative analytics.
Organizations ensure KPI dashboard accuracy through automated data validation, regular audits, standardized data collection processes, real-time monitoring systems, and clear governance protocols. These approaches streamline data integrity by eliminating manual errors, establishing consistent metrics definitions, and implementing continuous quality checks, with many companies finding that robust validation frameworks ultimately deliver more reliable insights and enhanced decision-making capabilities.
Common KPI dashboard mistakes include overloading with too many metrics, choosing vanity metrics over actionable ones, poor visual hierarchy, lack of real-time data integration, and failing to align KPIs with strategic objectives. These design flaws significantly reduce dashboard effectiveness, with many organizations finding that streamlined, purpose-driven dashboards enhance decision-making speed and operational clarity.
KPI dashboards facilitate better decision-making by providing real-time data visibility, trend analysis, and performance benchmarking across key metrics in one centralized interface. Through interactive visualizations and automated alerts, executives and managers can quickly identify underperforming areas, spot emerging opportunities, and make data-driven decisions faster, ultimately enhancing operational efficiency and strategic responsiveness.
Stakeholder feedback drives KPI dashboard development by ensuring metrics align with business priorities, user workflows, and decision-making needs across departments. Through collaborative input sessions, organizations refine dashboard layouts, visualization preferences, and performance indicators, while stakeholders validate data accuracy and usability, ultimately delivering dashboards that enhance strategic alignment and operational efficiency.
KPI dashboards can be tailored through customizable metrics, role-based access controls, departmental data filters, personalized visualizations, and flexible reporting intervals. Sales teams focus on revenue targets and conversion rates, while HR departments track employee satisfaction and retention metrics, with many organizations finding that department-specific customization enhances decision-making efficiency and operational alignment.
Leading KPIs predict future performance through metrics like pipeline activity, customer acquisition costs, and employee training hours, while lagging KPIs measure historical outcomes like revenue, profit margins, and customer retention rates. Effective dashboards strategically combine both by positioning leading indicators prominently for proactive decision-making and lagging metrics for performance validation, with many organizations finding that balanced representation enables faster strategic adjustments and improved forecasting accuracy.
Real-time data integration enhances KPI dashboards by providing instant visibility into performance metrics, eliminating data delays, and enabling immediate decision-making capabilities. Through automated data feeds, organizations streamline reporting processes, reduce manual errors, and deliver accurate insights across departments, with many companies finding that real-time integration ultimately improves operational efficiency and competitive responsiveness.
KPI dashboards for employee performance offer real-time visibility, standardized metrics, automated reporting, goal alignment, and performance trend analysis. These systems streamline management processes by eliminating manual tracking, enabling data-driven feedback conversations, and identifying top performers quickly, with many organizations finding that dashboard transparency ultimately enhances accountability and drives measurable productivity improvements.
Organizations balance information clarity and depth by implementing hierarchical dashboard designs, utilizing drill-down capabilities, and creating role-based views that display relevant metrics for specific user needs. Through interactive filtering, progressive disclosure techniques, and strategic use of visual hierarchy, companies in sectors like retail and healthcare can present high-level overviews while enabling deeper analysis, ultimately delivering both accessibility and comprehensive insights for informed decision-making.
Marketing KPI dashboards typically include conversion rates, customer acquisition cost, return on ad spend, lead generation metrics, and customer lifetime value. These metrics enable marketing teams to optimize campaign performance, allocate budgets strategically, and demonstrate ROI, with many organizations finding that comprehensive dashboards streamline decision-making and enhance overall marketing effectiveness.
-
Illustrative design with editable content. Exceptional value for money. Highly pleased with the product.
-
I had them make a presentation for an office retirement party. They were very helpful in understanding what we wanted and delivered the perfect presentation. Highly recommended!