

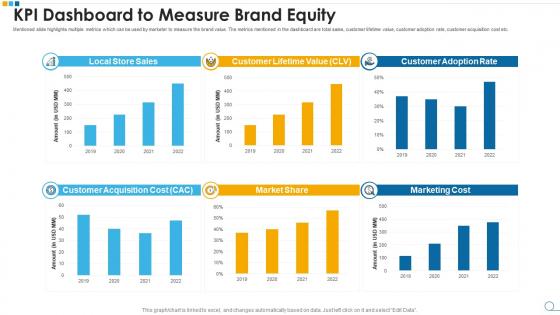
Kpi dashboard to measure brand equity




Try Before you Buy Download Free Sample Product
 Impress Your
Audience
 100%
Editable
 Save Hours
of Time


Our KPI Dashboard To Measure Brand Equity are topically designed to provide an attractive backdrop to any subject. Use them to look like a presentation pro.
People who downloaded this PowerPoint presentation also viewed the following :
Kpi dashboard to measure brand equity with all 7 slides:
Use our KPI Dashboard To Measure Brand Equity to effectively help you save your valuable time. They are readymade to fit into any presentation structure.







FAQs for Kpi dashboard to
Key brand equity metrics include brand awareness scores, net promoter score, customer lifetime value, market share percentage, and brand sentiment analysis from social media monitoring. These metrics streamline brand performance tracking by measuring recognition, loyalty, and competitive positioning, with many marketing teams finding that combining perception data with financial outcomes delivers comprehensive insights for strategic brand investments.
Customer perception can be quantitatively assessed through Net Promoter Score (NPS), brand awareness metrics, sentiment analysis scores, customer satisfaction ratings, and share of voice measurements. These metrics enable organizations to track perception shifts across multiple touchpoints, with companies in retail, financial services, and healthcare finding that combining survey data with social listening analytics delivers comprehensive insights, ultimately enhancing brand positioning and competitive advantage.
Social media sentiment analysis provides real-time insights into consumer perceptions, brand reputation trends, and emotional connections with your brand across digital platforms. Through advanced analytics tools, organizations can monitor mention volumes, sentiment shifts, and competitive positioning, while identifying potential reputation risks before they escalate, ultimately delivering actionable intelligence that enhances brand management strategies and customer engagement initiatives.
Brand loyalty can be effectively represented through repeat purchase rates, customer lifetime value, Net Promoter Score, churn rates, and brand preference metrics. These KPIs work together by tracking behavioral patterns, measuring advocacy levels, and monitoring retention trends, with many organizations finding that combining transactional data with sentiment analysis delivers comprehensive insights into customer commitment and long-term brand relationships.
Survey platforms like Qualtrics and SurveyMonkey, social listening tools such as Brandwatch and Hootsuite Insights, analytics platforms including Google Analytics and SEMrush, and consumer research services like Nielsen and Ipsos are most effective for brand equity measurement. These tools streamline data collection by tracking brand awareness, sentiment analysis, and competitive positioning across multiple touchpoints, with many organizations finding that combining quantitative surveys with real-time social monitoring delivers comprehensive insights for strategic brand management and market differentiation.
Brand equity KPI dashboards should typically be updated monthly or quarterly, depending on campaign intensity, market dynamics, and business cycles, with real-time metrics for social media engagement and customer sentiment. Many organizations find that quarterly updates provide sufficient strategic insight for brand positioning decisions, while monthly refreshes enable faster response to market changes, ultimately delivering more agile brand management and competitive advantage in increasingly dynamic markets.
Visual elements that enhance brand equity dashboard understanding include interactive charts, color-coded performance indicators, trend line graphs, comparative benchmarking displays, and heat maps for sentiment analysis. These design components streamline data interpretation by highlighting key performance shifts, enabling quick identification of brand strength fluctuations, and ultimately delivering clearer insights for strategic decision-making across marketing teams.
Competitor analysis contributes to brand equity KPI dashboards through market share comparisons, brand perception benchmarking, pricing positioning assessments, customer satisfaction rankings, and social media engagement metrics. These comparative insights enable organizations to identify competitive gaps, track relative brand performance, and uncover strategic opportunities, with many retail and financial services companies finding that competitor benchmarking ultimately delivers clearer positioning strategies and enhanced market differentiation.
Financial metrics integrate with brand equity measures through unified dashboards that track revenue correlation with brand awareness, customer lifetime value alongside brand loyalty scores, and market share performance against brand perception data. This strategic combination enables organizations to demonstrate clear ROI on brand investments, optimize marketing spend allocation, and ultimately deliver measurable business outcomes that connect brand strength directly to financial performance.
Common pitfalls include tracking vanity metrics without business impact, overcrowding dashboards with excessive KPIs, using inconsistent measurement periods, and failing to align metrics with strategic brand objectives. Many organizations find that focusing on actionable insights rather than data volume, establishing clear benchmark comparisons, and ensuring real-time data accuracy ultimately delivers more strategic value for brand management decisions.
Businesses can tailor their KPI dashboards by selecting metrics that align with their specific brand positioning, incorporating custom weightings for priority values, and integrating industry-relevant benchmarks alongside stakeholder feedback loops. Through personalized dashboard configurations, organizations enhance strategic decision-making, improve brand consistency across touchpoints, and accelerate performance optimization, with many finding that customized metrics deliver more actionable insights and stronger competitive advantage.
Tracking brand awareness is fundamental to brand equity because it measures market recognition and recall, directly correlating with customer acquisition potential, pricing power, and competitive positioning. Through awareness metrics, companies can identify market penetration gaps, optimize marketing spend allocation, and strengthen brand associations, with many retail and consumer goods brands finding that higher awareness significantly drives purchase consideration and customer loyalty.
Qualitative data transforms into quantitative brand equity insights through sentiment analysis algorithms, social media monitoring tools, survey response coding, focus group statistical analysis, and brand perception scoring systems. These methodologies enable organizations to convert customer feedback, brand associations, and emotional responses into measurable metrics like Net Promoter Scores, brand strength indices, and perception tracking scores, ultimately delivering actionable intelligence for strategic brand positioning.
Benchmarking strategies include competitor analysis, industry association reports, consumer perception surveys, market share comparisons, and brand valuation studies. These approaches enable organizations to assess positioning through direct competitive metrics, pricing power analysis, and customer loyalty measurements, ultimately delivering strategic insights that enhance competitive advantage and inform brand investment decisions across retail, technology, and financial services sectors.
Organizations ensure cross-departmental alignment with brand equity KPIs by establishing shared metrics, standardizing measurement frameworks, and implementing collaborative dashboard access across marketing, sales, and customer service teams. Through integrated platforms, departments can track consistent brand perception data, customer loyalty scores, and market positioning metrics, while regular cross-functional reviews enable unified strategic responses, ultimately delivering cohesive brand management and stronger competitive advantage.
-
It saves your time and decrease your efforts in half.
-
Visually stunning presentation, love the content.