

KPI Dashboard To Plan And Effectively Monitor Project Progress





Try Before you Buy Download Free Sample Product
 Impress Your
Audience
 100%
Editable
 Save Hours
of Time


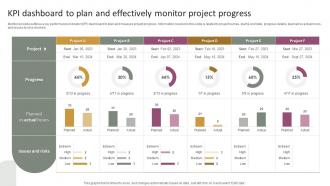
Mentioned slide outlines a key performance indicator KPI dashboard to plan and measure project progress. Information covered in this slide is related to project names, start and end date, progress details, planned vs actual hours, and issues and risks involved.
People who downloaded this PowerPoint presentation also viewed the following :
KPI Dashboard To Plan And Effectively Monitor Project Progress with all 7 slides:
Use our KPI Dashboard To Plan And Effectively Monitor Project Progress to effectively help you save your valuable time. They are readymade to fit into any presentation structure.






FAQs for KPI Dashboard To Plan And Effectively
Effective KPI dashboards include clear performance metrics, visual data representations, real-time updates, customizable filters, and actionable insights tailored to user roles. These components streamline decision-making by providing executives with comprehensive visibility into operational efficiency, while enabling departments like sales, marketing, and finance to track progress against strategic objectives, ultimately delivering faster responses to market changes and enhanced competitive advantage.
Organizations determine relevant KPIs by aligning metrics with strategic goals, identifying key business drivers, and analyzing what directly impacts revenue, efficiency, and customer satisfaction. Through stakeholder consultations and performance data analysis, companies across sectors like retail, healthcare, and manufacturing can prioritize metrics that measure progress toward specific objectives, ultimately enabling data-driven decision-making and competitive advantage.
Data visualization transforms KPI dashboards by making complex metrics instantly comprehensible through charts, graphs, heat maps, and trend lines that enable rapid pattern recognition. These visual elements streamline decision-making by allowing executives to quickly identify performance gaps, spot emerging trends, and compare metrics across departments, ultimately delivering faster strategic responses and enhanced operational efficiency.
KPI dashboards should be updated in real-time or daily for operational metrics, weekly for tactical performance indicators, and monthly for strategic objectives. The frequency depends on your business pace and decision-making needs, with many organizations finding that automated, real-time updates enhance responsiveness while scheduled reviews ensure strategic alignment and competitive advantage.
Common mistakes include overcrowding dashboards with too many metrics, using irrelevant KPIs that don't align with business objectives, poor visual design choices, and lacking real-time data integration. These design flaws undermine decision-making effectiveness by creating confusion and information overload, with many organizations finding that streamlined, strategically-focused dashboards ultimately deliver clearer insights and faster strategic responses.
Teams ensure effective KPI dashboard communication by prioritizing visual clarity, contextualizing metrics with benchmarks and trends, and tailoring presentations to stakeholder expertise levels. Through strategic data storytelling, automated alerts for critical thresholds, and regular review sessions, organizations streamline decision-making processes, enhance transparency, and ultimately deliver actionable insights that drive performance improvements across departments.
KPI dashboards deliver real-time visibility, automated data updates, interactive visualizations, and centralized performance tracking, while traditional reporting often involves static documents and delayed insights. These dashboards streamline decision-making by enabling instant access to critical metrics, reducing manual reporting overhead, and facilitating faster responses to performance changes, ultimately enhancing operational efficiency and strategic agility.
Organizations can customize KPI dashboards by implementing role-based access controls, creating department-specific metrics, adjusting visualization formats, and establishing personalized reporting frequencies that align with each team's objectives. Through modular dashboard designs, companies like retail chains tailor sales metrics for marketing teams while providing inventory data for operations, ultimately delivering targeted insights that enhance decision-making and operational efficiency.
**INPUT**: What tools or software are recommended for creating KPI dashboards? **OUTPUT**: Recommended KPI dashboard tools include Tableau, Power BI, Google Data Studio, Looker, and Qlik Sense, offering varying levels of customization and integration capabilities. These platforms streamline data visualization by connecting multiple sources, automating updates, and enabling real-time monitoring, with many organizations finding that strategic tool selection ultimately delivers enhanced decision-making speed and operational transparency.
Balancing KPI dashboard information involves prioritizing critical metrics, using visual hierarchy, and implementing progressive disclosure techniques that allow users to drill down for details. Through strategic design approaches like categorizing metrics by department, using color coding for performance thresholds, and creating role-based views, organizations streamline decision-making processes while maintaining comprehensive data access.
KPI dashboards drive accountability by providing transparent visibility into individual and team performance, establishing clear ownership of specific metrics, and enabling real-time tracking of progress against defined targets. Through automated performance monitoring, teams can identify underperformance early, facilitate data-driven discussions during reviews, and create a culture of continuous improvement, with many organizations finding that shared visibility motivates higher performance standards.
Historical data integrates into KPI dashboards through automated data warehousing, API connections, cloud-based storage systems, and real-time synchronization tools. These integrations enable organizations to identify performance patterns, predict future outcomes, and benchmark current metrics against past performance, with many companies finding that comprehensive historical views significantly enhance strategic decision-making and operational planning.
Best practices for presenting KPIs to non-technical stakeholders include using visual dashboards with clear charts, avoiding technical jargon, focusing on actionable insights, and providing context through benchmarks and trends. These approaches streamline communication by emphasizing business outcomes over data mechanics, with many organizations finding that simplified visualizations and executive summaries ultimately enhance decision-making speed and stakeholder engagement.
Mobile responsiveness can be incorporated through adaptive layouts, touch-friendly interfaces, simplified navigation, optimized data visualization, and progressive disclosure techniques. These design approaches streamline dashboard functionality by prioritizing critical metrics, using collapsible sections, and implementing swipe gestures, with many organizations finding that mobile-optimized dashboards enhance real-time decision-making and improve executive accessibility to key performance indicators.
Cultural differences significantly impact KPI interpretation in global organizations through varying communication styles, risk tolerance levels, time orientations, and performance measurement preferences. While Western cultures often emphasize individual metrics and short-term gains, Asian markets frequently prioritize collective outcomes and long-term sustainability, with many multinational companies finding that localized dashboard configurations ultimately deliver more accurate insights and stronger regional engagement.
-
“Excellent service from the customer support team when I wanted a slide that was a bit different from those on their standard menu. Super helpful.”
-
Excellent design and quick turnaround.