

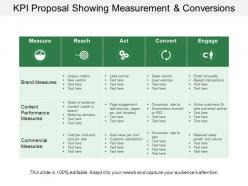
Kpi proposal showing measurement and conversions





Try Before you Buy Download Free Sample Product
 Impress Your
Audience
 100%
Editable
 Save Hours
of Time


Drive folks to churn out clever ideas with our Kpi Proposal Showing Measurement And Conversions. You will inspire the intelligent.
People who downloaded this PowerPoint presentation also viewed the following :
Kpi proposal showing measurement and conversions with all 5 slides:
Build the foundation for generations to come with our Kpi Proposal Showing Measurement And Conversions. Encourage a futuristic approach.


FAQs for Kpi proposal showing
Okay so for KPIs, you'll want four things: they gotta align with actual business goals, be measurable with real data, have deadlines, and get stakeholder agreement upfront. Don't pick vanity metrics just because they sound impressive - I've watched projects crash because nobody could actually track what they promised. Can you realistically measure this stuff with your current tools? Set deadlines that make sense. The stakeholder buy-in part is huge though - get everyone to agree on what "success" means before you start. List out 3-5 options first, then test each one against those criteria. Way easier than backtracking later.
Map each KPI straight back to your strategic goals - can't connect them? Drop it. Way too many teams get caught up tracking metrics that look cool but don't actually matter. Pick 3-5 that genuinely show progress on what you're trying to accomplish. Everyone needs to get why you're measuring these things, not just what the numbers are. I'd check quarterly since priorities always shift around. Here's my test: if this metric jumped 20%, would it actually move us closer to our big goals? That question cuts through so much BS.
Honestly, you can't go wrong with the big three: NPS, CSAT, and CES. NPS shows if people would actually recommend you to friends - everyone's obsessed with it for good reason. CSAT is more specific, measuring how satisfied customers are with particular interactions. Then there's CES, which tracks how much effort customers have to put in (spoiler: less is always better). Don't sleep on retention rates either. Happy customers stick around and buy again. Start with NPS and CSAT - they're pretty straightforward to set up. You can always add CES later once you've got the survey thing down.
Automate your data collection as much as you can - that's where most screw-ups happen with manual entry. Set up alerts for weird spikes or dips in your numbers. Seriously, catching that stuff early will save you so much time later. Make sure everyone's pulling from the same data sources and actually understands how you're calculating each KPI. I learned this the hard way when our team was using different formulas for the same metric. Build validation checks right into your process instead of relying on people to remember checking things.
You absolutely need stakeholder input - without their buy-in, your KPIs are basically worthless. These people live in the trenches daily, so they'll know what's actually measurable and what metrics won't backfire on their teams. If they feel left out of the decision-making, don't expect them to care about hitting numbers later. Get them involved early during brainstorming sessions. Ask about feasibility and whether your ideas might create weird incentives. I've seen too many "brilliant" KPI plans crash because nobody bothered asking the people who'd actually use them.
Honestly, KPIs work best when your team actually helps pick them - that buy-in is huge. People need clear targets that connect to the bigger picture, but not some impossible stretch goals that just stress everyone out. Real-time progress tracking keeps people engaged (like a game scoreboard). Here's what I'd focus on: tie those metrics to actual career growth and recognition. Nobody cares about hitting numbers that only make the C-suite happy. You want stuff that pushes people but doesn't feel pointless. When employees can see how their daily work moves the needle on company goals, that's when the magic happens. Start there and you'll see the difference.
Honestly, most people go crazy with too many KPIs and end up tracking nothing well. Pick like 3-5 max or you'll lose your mind. Avoid the fluffy metrics that just stroke your ego - vanity numbers might look impressive but they won't actually move your business. Also super annoying when you set KPIs your team can't even control. Nothing kills morale faster. Make sure each one has someone who owns it and connects to what you're actually trying to achieve. The worst thing? Setting them once and never looking again. I see this all the time. Review regularly and adjust when needed.
Check your KPIs every quarter, honestly. When your business shifts gears—like pivoting from pure growth mode to actually making money—your metrics should shift too. I've watched teams obsess over numbers that haven't mattered in months, which is just painful to see. New products? Different priorities? Time to update what you're measuring. Set up those calendar reminders because we all forget this stuff. Quick test: if you nailed every KPI target tomorrow, would it actually matter for your current goals? If not, ditch the old metrics and find ones that'll push the right buttons.
Dude, there's actually a bunch of ways to handle this. Tableau and Power BI are solid if you want something robust - they'll hook right into your data sources. Google Data Studio works too and it's free, which is nice. For basic stuff, honestly Excel or Google Sheets can do the job with some formulas and auto-refresh. I've watched teams blow money on fancy enterprise solutions when Monday.com or even Asana's built-in reports would've worked fine. Really depends where your data sits though - CRM, Google Analytics, whatever. My advice? Start with something simple first, then upgrade if you outgrow it.
Mix your hard numbers with actual stories from customers - like showing satisfaction scores next to real feedback quotes. Revenue stats hit different when you add why sales reps think deals actually closed or tanked. Dashboards work great for this - numbers on one side, survey themes on the other. You can even score qualitative stuff numerically if that's your thing, like rating feedback sentiment 1-5. Just make sure the soft data actually explains your trends instead of sitting there looking pretty. Otherwise what's the point, you know?
Dude, you've gotta match your audience. Execs want the big picture stuff - trends, business impact, that kind of thing. But your ops teams? They need the nitty-gritty details they can actually do something with. I swear, showing up with the same format every time is like half the win - people hate surprises in data meetings. Tell the story behind your numbers instead of just throwing charts at them. Oh, and always wrap up with what they should actually DO next. There's nothing worse than sitting through a presentation that basically ends with "so... yeah, there's your data."
I'd go with roughly 70% leading indicators, 30% lagging. Leading stuff like training completion or customer engagement lets you fix things before they tank your numbers. Revenue and churn rates matter too, but honestly they just tell you what's already done. Map each lagging metric to leading ones that actually move the needle. Track both religiously. Use the leading indicators to pivot in real-time so you actually hit those bigger targets. Works way better than just watching your revenue after the fact.
You really need to pick KPIs that actually matter for your industry. Retail? Focus on inventory turnover and customer lifetime value - they directly impact your profits. SaaS is all about monthly recurring revenue and churn rates. Manufacturing companies should watch equipment downtime and defect rates like hawks. Healthcare orgs need patient satisfaction scores and readmission rates (regulators are obsessed with those). Honestly, most people track way too many metrics. Just pick 3-4 that actually affect your business, not the flashy ones that look impressive in meetings but don't tell you anything useful.
Honestly, clear KPIs are a game-changer for accountability. Your team actually knows what they're shooting for instead of guessing. No more finger-pointing when stuff hits the fan because everyone gets their targets and how they fit together. The peer pressure thing is real too - people can see how their work affects everyone else. You'll be shocked how much people start managing themselves once expectations aren't murky. Oh, and don't just throw numbers at them. Explain why each metric matters or you'll lose half the team.
Honestly, just make the data part of normal conversations instead of those boring monthly meetings everyone dreads. Build dashboards that don't look like accounting nightmares - keep them simple so people actually get it. Train your team on what the numbers mean for their jobs specifically. I do these quick "data check-ins" during regular meetings where we celebrate good stuff or figure out what's going wrong. The biggest thing though? Use the data yourself when making decisions and tell people why. Like "hey, we're doing X because the numbers show Y." Makes it feel way less scary and more like... just how you work, you know?
-
Amazing product with appealing content and design.
-
Unique and attractive product design.