

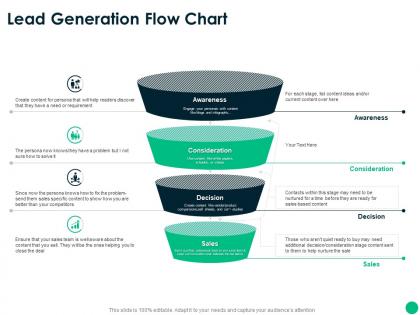
Lead generation flow chart ppt powerpoint presentation styles icons




Try Before you Buy Download Free Sample Product
 Impress Your
Audience
 100%
Editable
 Save Hours
of Time


Generate a definitive influence with our Lead Generation Flow Chart Ppt Powerpoint Presentation Styles Icons. Bring about a change of attitude.
People who downloaded this PowerPoint presentation also viewed the following :
Lead generation flow chart ppt powerpoint presentation styles icons with all 2 slides:
Bring about a change in attitude with our Lead Generation Flow Chart Ppt Powerpoint Presentation Styles Icons. You will generate a definite influence.


FAQs for Lead generation flow chart ppt powerpoint
Key stages in a lead generation flow chart include awareness creation, interest cultivation, lead capture, qualification assessment, nurturing sequences, and conversion optimization. These interconnected phases streamline prospect journey management by identifying potential customers, gathering contact information, and scoring engagement levels, with many sales teams finding that structured workflows ultimately enhance conversion rates and accelerate revenue growth.
A well-structured lead generation flow chart improves conversion rates by mapping clear customer journeys, identifying optimization opportunities, and eliminating friction points that cause prospect drop-off. Through systematic visualization, businesses can streamline touchpoints, personalize messaging at each stage, and implement targeted follow-ups, with many organizations finding that structured flows increase conversions by 20-30% while reducing acquisition costs.
Common tools for creating lead generation flow charts include Lucidchart, Microsoft Visio, Draw.io, Canva, and Miro, each offering templates and drag-and-drop functionality for mapping customer journeys. These platforms streamline workflow visualization by enabling real-time collaboration, automated integrations, and customizable templates, with many marketing teams finding that visual mapping enhances lead nurturing strategies and conversion optimization.
Visuals in lead generation flow charts enhance stakeholder understanding by simplifying complex processes, highlighting key decision points, showing clear progression paths, and identifying bottlenecks or optimization opportunities. Through intuitive diagrams and visual elements, marketing teams, sales departments, and executives can quickly grasp conversion stages, resource allocation needs, and performance metrics, ultimately enabling faster strategic decisions and improved campaign coordination across organizations.
Lead generation flow charts should include conversion rates at each stage, lead quality scores, cost per lead, time to conversion, and source attribution metrics. These measurements enable organizations to identify bottlenecks, optimize underperforming channels, and allocate resources strategically, with many businesses finding that tracking these metrics improves their overall conversion efficiency by twenty to thirty percent.
Different industries adapt lead generation flow charts by customizing touchpoints, qualification criteria, and nurturing sequences to match their unique customer journeys and sales cycles. Healthcare organizations focus on compliance and trust-building stages, while SaaS companies emphasize free trials and product demonstrations, and manufacturing businesses incorporate longer evaluation periods with technical specifications, ultimately delivering more targeted prospects and higher conversion rates across diverse market segments.
Common bottlenecks in lead generation flow charts include unqualified lead capture, delayed follow-up responses, inadequate lead scoring systems, poor handoff processes between marketing and sales, and insufficient nurturing sequences. These challenges often result in lost opportunities, decreased conversion rates, and reduced ROI, with many organizations finding that streamlined automation and clear qualification criteria significantly enhance their lead progression and ultimately deliver faster sales cycles.
Businesses can leverage automation in their lead generation flow chart through CRM integration, email marketing sequences, lead scoring systems, chatbot interactions, and social media monitoring tools. These technologies streamline prospect identification, nurture campaigns, and qualification processes, with many organizations finding that automated workflows reduce manual tasks by 60% while accelerating conversion rates and improving sales team efficiency.
Customer personas serve as the foundation for developing effective lead generation flow charts by defining target audience characteristics, pain points, preferred communication channels, and decision-making behaviors. These detailed profiles enable businesses to create tailored messaging, select appropriate touchpoints, and design conversion paths that resonate with specific segments, ultimately delivering higher-quality leads and improved conversion rates across industries.
Integrating marketing and sales processes requires defining clear handoff points, shared lead scoring criteria, and unified tracking systems within your flow chart. This strategic alignment streamlines the customer journey from initial awareness through conversion, with many organizations finding that synchronized processes reduce lead response times, improve qualification accuracy, and ultimately deliver higher conversion rates and stronger revenue growth.
Common mistakes include overcomplicating the process with too many steps, failing to define clear target personas, neglecting mobile optimization, and lacking proper follow-up sequences. Many organizations find that unclear conversion goals, insufficient tracking mechanisms, and poor integration between marketing and sales teams ultimately undermine their lead generation effectiveness, while streamlined approaches with defined touchpoints deliver significantly better conversion rates and customer acquisition outcomes.
Feedback loops in lead generation flow charts can be effectively illustrated through curved arrows connecting conversion outcomes back to earlier stages, color-coded pathways showing different customer responses, and decision diamonds that redirect leads based on engagement levels. These visual elements enable marketing teams to track lead nurturing effectiveness, optimize conversion touchpoints, and create dynamic campaigns that adapt to prospect behavior, ultimately delivering higher-quality leads and improved ROI across sales funnels.
Lead generation flow charts streamline team training by providing visual guidance on prospect qualification, nurturing sequences, conversion processes, and handoff protocols between departments. These structured frameworks enable new hires to understand complex sales funnels quickly, reduce onboarding time significantly, and ensure consistent lead handling across teams, with many organizations finding that visual processes accelerate competency development.
A lead generation flow chart should be revised quarterly or whenever significant changes occur in market conditions, customer behavior, or business objectives. Regular updates ensure optimal performance by incorporating new technologies, addressing conversion bottlenecks, and adapting to evolving buyer journeys, with many organizations finding that consistent refinements deliver improved lead quality and higher conversion rates.
Lead generation optimization strategies include targeted content marketing, multi-channel prospecting, automated nurturing sequences, personalized follow-ups, and data-driven qualification processes across each flowchart phase. These approaches streamline conversion by enhancing lead quality, accelerating decision timelines, and improving sales alignment, with many organizations finding that strategic automation combined with personalized touchpoints ultimately delivers higher conversion rates and reduced acquisition costs.
No Reviews