

Learning Dashboard Powerpoint Ppt Template Bundles




Try Before you Buy Download Free Sample Product
 Impress Your
 Audience
 100%
100% Editable
 Save Hours
 of Time


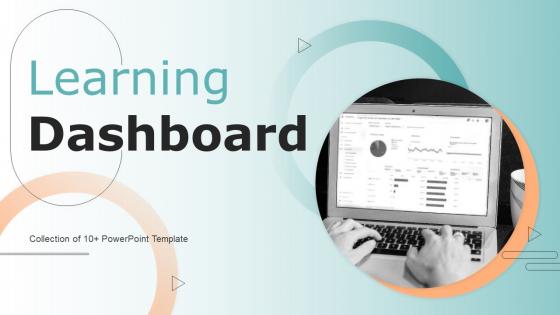
Our Learning Dashboard Powerpoint Ppt Template Bundles are topically designed to provide an attractive backdrop to any subject. Use them to look like a presentation pro.
People who downloaded this PowerPoint presentation also viewed the following :
Learning Dashboard Powerpoint Ppt Template Bundles with all 18 slides:
Use our Learning Dashboard Powerpoint Ppt Template Bundles to effectively help you save your valuable time. They are readymade to fit into any presentation structure.





FAQs for Learning Dashboard Powerpoint
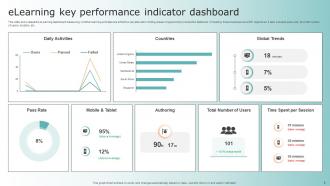
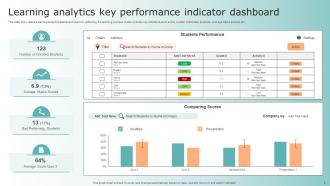
Effective learning dashboards should include student engagement rates, completion percentages, assessment scores, time-on-task metrics, and progress tracking indicators. These metrics enable educational institutions to identify at-risk students, optimize curriculum delivery, and enhance learning outcomes, with many schools finding that comprehensive dashboards improve retention rates and academic performance significantly.
Learning dashboards enhance student engagement by providing real-time progress visualization, personalized learning pathways, goal-setting tools, and interactive feedback mechanisms that motivate continuous improvement. These platforms enable educators to track performance patterns, identify at-risk students early, and customize interventions accordingly, with many educational institutions finding that data-driven insights ultimately deliver improved learning outcomes and higher student retention rates.
Data visualization transforms learning dashboards by converting complex educational data into intuitive charts, graphs, progress bars, heatmaps, and interactive elements that users can quickly understand and act upon. These visual representations enable educators, students, and administrators to identify learning patterns, track performance trends, and make informed decisions more efficiently, while reducing cognitive load and enhancing user engagement, ultimately delivering better educational outcomes and streamlined learning experiences.
Educators can customize learning dashboards by adjusting content difficulty levels, incorporating multiple assessment formats, setting individualized learning pathways, and integrating accessibility features for diverse learning styles. These personalization tools enable teachers to track student progress across different subjects and skill levels, while providing targeted interventions and adaptive content delivery, ultimately enhancing educational outcomes and engagement.
Learning dashboards can integrate student information systems, learning management platforms, assessment tools, engagement analytics, attendance records, and performance databases. These diverse data sources streamline educational insights by combining academic progress, behavioral patterns, and learning outcomes, enabling educators to deliver personalized instruction and enhanced student experiences across institutions.
Learning dashboards support personalized learning by tracking individual progress, identifying knowledge gaps, adapting content difficulty, and providing customized learning pathways based on performance analytics. Through real-time data visualization, educators can tailor instruction while students receive targeted recommendations, ultimately enabling more effective learning outcomes and improved academic achievement across diverse educational institutions.
**INPUT**: What tools and software are recommended for creating interactive learning dashboards? **OUTPUT**: Recommended tools include Tableau, Power BI, Google Data Studio, Qlik Sense, and specialized platforms like Articulate Rise and Adobe Captivate. These technologies streamline educational analytics by enabling real-time progress tracking, personalized learning paths, and comprehensive performance visualization, with many educational institutions finding that interactive dashboards enhance student engagement while delivering actionable insights for instructors.
Learning dashboards facilitate communication by providing shared, real-time visibility into student progress, assignment completion, learning objectives, and performance trends across subjects. Through centralized data visualization, teachers can efficiently update parents on academic developments, students can track their own growth and communicate specific challenges, while parents gain meaningful insights into daily learning activities, ultimately enabling more informed, collaborative conversations that support student success and strengthen the home-school partnership.
Best practices for designing intuitive learning dashboards include clear visual hierarchy, personalized content paths, progress tracking indicators, accessible navigation menus, and responsive design elements. These design principles enhance user engagement by streamlining course discovery, minimizing cognitive load, and delivering seamless experiences across devices, with educational institutions and corporate training programs finding that well-structured dashboards significantly improve completion rates.
Learning dashboards assist in identifying gaps by tracking performance metrics, completion rates, assessment scores, and engagement patterns across different modules and learners. Through visual analytics and real-time reporting, educators and administrators can pinpoint struggling areas, compare individual progress against benchmarks, and customize interventions, ultimately enabling targeted support strategies that enhance learning outcomes and institutional effectiveness.
Privacy and security considerations for learning dashboards include data encryption, user access controls, GDPR compliance, secure authentication protocols, and anonymization of sensitive student information. Educational institutions increasingly find that implementing role-based permissions, regular security audits, and transparent data usage policies builds trust while protecting learner privacy, ultimately enabling safer personalized learning experiences.
Real-time data updates enhance learning dashboard effectiveness by providing immediate insights into learner progress, identifying knowledge gaps as they occur, and enabling instant course corrections. This continuous feedback loop allows educators and administrators to adjust content delivery, allocate support resources strategically, and optimize learning pathways dynamically, ultimately delivering personalized educational experiences that significantly improve completion rates and learning outcomes.
Common implementation challenges include data integration complexities, user adoption resistance, technical infrastructure limitations, privacy compliance requirements, and staff training needs. Educational institutions often find that while learning dashboards enhance student tracking, teacher efficiency, and administrative oversight, they require strategic planning, adequate technical support, and comprehensive training programs to maximize their effectiveness and ensure sustainable adoption across diverse learning environments.
Data from learning dashboards informs curriculum design by revealing knowledge gaps, learning patterns, engagement levels, and performance trends across different modules and student populations. Educational institutions leverage these analytics to redesign course sequences, adjust pacing, personalize instructional approaches, and identify content areas needing enhancement, ultimately delivering more effective curricula and improved student outcomes.
Learning dashboards contribute to continuous improvement by providing real-time visibility into student progress, learning outcomes, and instructional effectiveness across classrooms and institutions. These systems enable educators to identify knowledge gaps, track skill development, and adjust teaching strategies based on data-driven insights, with many schools finding that transparent performance metrics foster collaborative problem-solving and ultimately enhance both student achievement and institutional accountability.
-
I was never satisfied with my own presentation design but SlideTeam has solved that problem for me. Thank you SlideTeam!
-
Incredibly beautiful designs that will help you get noticed! These eye-catching templates are perfect for corporate presentations that can be altered to fit any occasion or taste.