

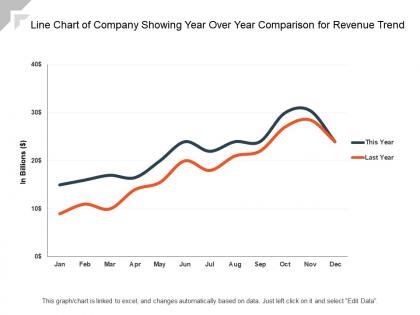
Line chart of company showing year over year comparison for revenue trend




Try Before you Buy Download Free Sample Product
 Impress Your
Audience
 100%
Editable
 Save Hours
of Time


Encourage a composite dialogue with our Line Chart Of Company Showing Year Over Year Comparison For Revenue Trend. Include every angle in the agenda.
Presenting this set of slides with name Line Chart Of Company Showing Year Over Year Comparison For Revenue Trend. The topics discussed in these slides are Revenue Trend, Finance, Chart And Graph. This is a completely editable PowerPoint presentation and is available for immediate download. Download now and impress your audience.
People who downloaded this PowerPoint presentation also viewed the following :
Line chart of company showing year over year comparison for revenue trend with all 6 slides:
Include every angle in the agenda with our Line Chart Of Company Showing Year Over Year Comparison For Revenue Trend. Encourage a composite dialogue.


Most Relevant Reviews
No Reviews