

Line chart powerpoint show





Try Before you Buy Download Free Sample Product
 Impress Your
Audience
 100%
Editable
 Save Hours
of Time


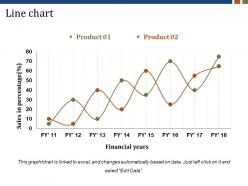
Demonstrate your company’s data using this Line Chart PowerPoint presentation. You can showcase the comparative study of two or more products using this statistical chart PowerPoint theme. Employing this line graph PPT layout, you can highlight a series of data points linked by a straight line. This chronological data record PPT template can be incorporated to discuss the significance of depicting information in an easy to interpret data. You can utilize this curve chart PowerPoint theme to discuss with your employees the various components affecting the product sales with respect to financial years. Employ this data interpretation PPT theme to pinpoint the key execution issues to suggest strategies accordingly to your teammates. The trend prediction and data comparison can be illustrated effectively to your colleagues using our line plot PowerPoint layout. Professionals from finance background can download this curve chart PPT slide to discuss your enterprise’s asset price action in a definite time frame.
People who downloaded this PowerPoint presentation also viewed the following :
Line chart powerpoint show with all 5 slides:
Make a compelling gesture with our Line Chart Powerpoint Show. They will feel the force of your determination.



-
It saves your time and decrease your efforts in half.
-
Understandable and informative presentation.