

Location ppt rules





Try Before you Buy Download Free Sample Product
 Impress Your
Audience
 100%
Editable
 Save Hours
of Time


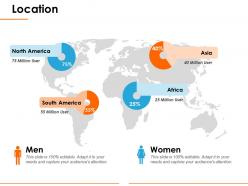
The location PPT template is an ultimate tool for awesome geographical presentation. This world map PowerPoint template is an earth map 2D layout with location pin clipart icons. The earth map PPT template is a single slide PPT template which is basically a flat design. This creative presentation template is perfect for professional business presentations. This slide is designed to showcase the percentage or comparison of men and women in specific locations. Through this PPT template, the presenter can also showcase various branches that the company has in the world. The presenter can use this slide to define sales territories and potential of business opportunities in the global market. This slide is also ideal for travel companies. The user can use this slide to mark various locations for travel route discussions also. The location PPT template uses high-resolution graphics to ensure the modern look and better visuals of the presentation. Download this location PPT template for the best business presentation and ensure the message is conveyed to the audience in the best possible way. Improve cohesion with our Location Ppt Rules. Identify factors that are good for all.
People who downloaded this PowerPoint presentation also viewed the following :
Location ppt rules with all 5 slides:
Eliminate factors causing fluctuations with our Location Ppt Rules. Be able to counter any instability.


FAQs for
Key elements include detailed maps with clear boundaries, demographic data and population statistics, transportation networks and accessibility routes, economic indicators and local market conditions, and infrastructure details like utilities and connectivity. These components work together by providing comprehensive geographical context, enabling stakeholders to assess strategic positioning, resource availability, and market potential, ultimately delivering informed location-based decisions and competitive advantage.
Visuals enhance location understanding by providing immediate geographic context, spatial relationships, and cultural markers that text alone cannot convey. Through interactive maps, satellite imagery, and infographic overlays, presenters can illustrate demographic patterns, market penetration, and regional opportunities, while location-based charts and heat maps enable audiences to grasp complex geographic data instantly, ultimately delivering more compelling and memorable presentations.
Engaging techniques for location-based data include interactive maps, visual storytelling through geographic comparisons, real-time data overlays, audience polling about local insights, and layered information reveals. These approaches enhance comprehension by connecting geographic patterns to business outcomes, enabling audiences to visualize regional performance, market opportunities, and operational efficiencies, ultimately delivering more memorable and actionable presentations.
Cultural context significantly influences location presentation through visual hierarchy preferences, color symbolism, reading patterns, and regional familiarity expectations. Organizations adapting presentations for global audiences find that incorporating culturally appropriate design elements, local landmarks for reference points, and region-specific data visualization styles enhances comprehension and engagement across diverse stakeholders.
Common pitfalls include over-generalizing without local context, ignoring cultural sensitivities, using outdated demographic data, failing to address regional regulations, and presenting irrelevant case studies from different markets. These oversights can undermine credibility and engagement, with many presenters finding that thorough local research, culturally-aware messaging, and region-specific examples ultimately deliver more impactful and trusted presentations.
Maps and geographic information systems (GIS) significantly enhance location presentations by providing visual context, enabling spatial analysis, and delivering interactive data visualization capabilities. These technologies streamline complex geographic information into accessible formats, with urban planners, real estate developers, and logistics companies finding that GIS-powered presentations improve stakeholder understanding and accelerate decision-making processes.
Storytelling can be integrated through historical narratives, customer success stories, economic transformation tales, and future vision scenarios that connect emotionally with stakeholders. These narrative techniques enhance location presentations by creating memorable contexts, demonstrating real-world impact, and illustrating potential outcomes, with many organizations finding that story-driven presentations significantly increase audience engagement and investment decisions.
Audience analysis enables presenters to customize location presentations by understanding stakeholder priorities, technical expertise levels, decision-making authority, and specific concerns about geographical factors. Through demographic research, role assessment, and interest mapping, organizations can emphasize relevant location benefits like logistics advantages for operations teams or market access for executives, ultimately delivering more persuasive and targeted presentations that resonate with each audience segment.
Presenters can effectively highlight location history through storytelling techniques, visual timelines, archival imagery, interactive maps, and connecting historical events to current significance. These approaches enhance audience engagement by transforming abstract historical facts into compelling narratives, with museums, tourism boards, and educational institutions finding that strategic historical context creates deeper emotional connections and memorable experiences that drive visitor interest and cultural appreciation.
Location data from secondary sources requires proper attribution, clear methodology disclosure, data accuracy verification, and transparent sourcing documentation throughout your presentation. Organizations should cite original data providers, explain collection methods, acknowledge any limitations or potential biases, and provide access dates, while many financial services and healthcare institutions finding that this transparency builds stakeholder trust and ensures regulatory compliance.
Presenters can ensure inclusive location presentations by incorporating diverse cultural viewpoints, acknowledging historical context from multiple perspectives, using representative imagery, and avoiding stereotypes or generalizations about places and communities. This approach enhances audience engagement across different backgrounds while building credibility, with many organizations finding that culturally sensitive presentations deliver stronger stakeholder buy-in and broader market appeal.
Tools for dynamic location presentations include GIS mapping software, interactive presentation platforms like Prezi and Genially, augmented reality applications, 3D visualization tools, and GPS integration technologies. These solutions enhance audience engagement by enabling real-time data overlays, clickable hotspots, and immersive geographic exploration, with many organizations finding that interactive mapping significantly improves stakeholder understanding and decision-making processes.
Location presentations can be structured using geographical progression, thematic organization by key factors, problem-solution frameworks, and timeline-based sequences that guide audiences through spatial relationships logically. These approaches enhance comprehension by connecting locations through proximity, shared characteristics, or developmental stages, with many organizations finding that strategic sequencing from broad regional overviews to specific site details ultimately delivers clearer decision-making frameworks and stronger stakeholder engagement.
When presenting sensitive location-related data, ethical considerations include obtaining proper consent, ensuring data anonymization, respecting privacy boundaries, maintaining transparency about data usage, and implementing robust security measures. These principles help organizations build trust while delivering valuable insights, with many companies in healthcare, finance, and retail finding that ethical data practices ultimately enhance stakeholder relationships and competitive positioning.
Presenters can measure location presentation impact through audience feedback surveys, engagement metrics like participation rates and question frequency, comprehension assessments, and post-presentation follow-up discussions. These measurement approaches enable organizations to track knowledge retention, identify content gaps, and refine delivery methods, with many companies finding that systematic evaluation enhances training effectiveness and audience outcomes.
-
Unique design & color.
-
Attractive design and informative presentation.