

Logistics dashboard showing inventory to sales and inventory turnover





Try Before you Buy Download Free Sample Product
 Impress Your
Audience
 100%
Editable
 Save Hours
of Time


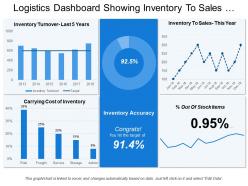
A Logistics Dashboard Showing Inventory PowerPoint template is the perfect tool for illustrating the turnover of an organization. A business annual report is usually created every year by organizations to represent the facts and analyze statistics resulting from previous five years by taking help of Inventory to Sale Dashboard PPT slide. The main purpose of preparing an annual report is to give investors as well as company directors the core information about the business operations and it gets easy when a presenter add this slide in his presentation. Supply Chain Report Presentation Template helps in highlighting the end-to-end solutions. With the help of a Graphical Inventory PowerPoint slide, you can deliver your business key factors such as Operational Activities, Data Statistics on Cost & Expenditures, Financial Highlights & Profitability and Partnership & Globalization. A user can link the Inventory Turnover template with the Excel data sheet. This Inventory Report PowerPoint slide is not only helpful in providing you with data but help you to visualize strategic priorities as well as concrete goals for your business. Time to bring your presentations to the next level. Logistics Dashboard Showing Inventory To Sales And Inventory Turnover are on hand to upgrade your presentations.
People who downloaded this PowerPoint presentation also viewed the following :
Logistics dashboard showing inventory to sales and inventory turnover with all 6 slides:
Acquire awards galore with our Logistics Dashboard Showing Inventory To Sales And Inventory Turnover. Be declared the best at any event.


FAQs for Logistics dashboard showing inventory to sales
Focus on delivery times first - like on-time rates and delays. Cost stuff matters too: cost per shipment, fuel expenses. Then track your inventory levels and how well you're using your trucks and warehouse space. Route optimization is huge, plus driver performance metrics. Honestly, I've watched so many teams chase fancy metrics that look impressive but don't actually help anyone make better decisions day-to-day. Customer satisfaction scores are obvious but necessary. Oh, and set up alerts for when things go sideways. Start simple with these basics, then add more detailed tracking once everyone's used to checking the dashboard regularly.
Dude, real-time data integration is a total game changer - it turns your logistics dashboard into this live command center instead of some outdated snapshot. GPS trackers, warehouse systems, carrier APIs all feed directly in, so you're seeing shipment locations and inventory levels as they actually change. No more calling drivers every five minutes (seriously, who has time for that?). Spot problems instantly, reroute stuff when needed. Your customers get accurate ETAs without you having to guess. It's honestly wild how much smoother everything runs when data flows automatically instead of those clunky batch updates.
KPI scorecards are clutch - they give you those instant snapshots of delivery performance and inventory turns. I'd definitely throw in some trend lines too since they're perfect for catching patterns in lead times or demand over time. Heat maps are solid for geographic stuff or finding bottlenecks across suppliers. Honestly? Skip the fancy pie charts - I've worked with too many dashboards that look pretty but don't actually help anyone. Your stakeholders just need to spot problems fast and know where to investigate. Keep it simple and make sure everything's actionable, otherwise what's the point?
So basically you'd hook up machine learning to all your shipping data - past deliveries, demand patterns, route info, that stuff. The algorithms dig through everything and spit out predictions for delivery times, inventory needs, where things might get stuck. Tableau and Power BI actually have this built in now which is clutch, way less headache than before. Focus on the big stuff first - seasonal spikes, how your carriers are performing, route optimization. Oh and definitely start small! Pick something like delivery forecasting, nail that down, then branch out. Trust me, trying to do everything at once is a disaster.
Look, your dashboard UX can make or break everything in logistics. When there's a crisis, people need to jump in and instantly see what's wrong - no digging through terrible menus. Quick decisions happen with complex data, so if operators can't spot delays or find shipment info fast, you're screwed. Smart alerts are huge. Clean layout matters too, but honestly the workflow design is what counts most. Match how your team actually operates day-to-day, not some fancy demo that looks good but doesn't work. Customizable views help, but keep it simple enough for anyone to use under pressure.
Oh dude, you'll love this - basically everyone can see the same stuff in real time instead of that annoying back-and-forth between departments. Sales knows what's actually in stock, finance sees shipping costs as they happen, operations gets the priority list. Gone are those "lemme ask Karen and get back to you" delays that drive everyone nuts. When shipments get screwed up (and they will), there's way less drama about whose fault it was. Plus you can set alerts so the whole team knows immediately instead of someone finding out days later like "wait, WHAT happened??"
Honestly, pick like 3-4 KPIs max to start with - I made the mistake of trying to track everything once and it was useless. Go for the ones that actually move the needle: on-time delivery, inventory turnover, cost per shipment, stuff like that. Put your most critical metrics right at the top since that's what you'll check every morning anyway. Here's the thing though - ask your ops team what they actually need before building it. Half the time what leadership thinks matters isn't what the floor needs day-to-day. Run it for a couple weeks, see what people ignore, then tweak it. Way better than perfecting something nobody uses.
Mobile dashboards are seriously a huge win for logistics teams. Your drivers can update delivery status on the go instead of calling it in or waiting until they're back. Warehouse guys check inventory right from their phones - no more running to a computer every time. Honestly, once managers can monitor everything from anywhere, it changes the whole game. Problems get spotted way faster, and everyone stays updated automatically. The key is just making sure it actually works smoothly on phones and tablets first. That's where you'll see the biggest difference in how your teams operate day-to-day.
Tableau and Power BI are probably your best bet - they're the gold standard for a reason. Google Data Studio works if you're on a tight budget though. Real-time stuff? Grafana's pretty solid, or you could build something custom with D3.js if your dev team's up for it. Honestly, I've watched so many people overthink this and blow money on features they never use. Simple charts usually beat fancy widgets anyway. My advice? Figure out what data you're actually working with first, then find whatever connects to it without being a total pain to set up.
Look at your dashboard and check where delays keep happening in the same spots. Transit times getting weird? Inventory backing up somewhere? Those heat maps are honestly the best place to start - they'll show you problem areas right away. I'd set up alerts for anything that goes past normal thresholds so you don't miss stuff. When something pops up, dig into the details to find what's actually causing it. Oh and watch carrier performance on specific routes too - that can reveal patterns you might miss otherwise.
Real-time alerts are a must - shipment delays, route changes, and inventory running low. Temperature monitoring if you're dealing with anything sensitive. Also delivery exceptions and capacity warnings. But seriously, don't go overboard or your team will just start ignoring everything (learned that one the hard way). I'd set up different alert levels so the urgent stuff gets escalated properly. Start with just the critical alerts first. You can always add more detailed ones later once everyone's used to it. Trust me, alert fatigue is real and kills productivity fast.
Honestly, historical data is clutch for this stuff. Pull about 6-12 months worth and use it to set realistic benchmarks - you'll catch patterns your real-time metrics totally miss. Seasonal shipping trends, how carriers actually perform over time, regional delivery quirks. It's perfect for predictive analytics too since you can spot bottlenecks coming. Plus it helps you build way better alerts because you'll know what normal looks like versus actual problems. I'd start with your top 3-5 KPIs first though, don't go crazy trying to baseline everything at once.
Honestly, the hardest part is dealing with data that's scattered everywhere and getting teams to stop hoarding their favorite metrics. IT and ops will probably clash at first - classic turf war stuff. Pick your most important KPIs and tackle one data source at a time. Don't try to connect everything day one, you'll go insane. Clean data is everything though - messy inputs = useless dashboard. Loop stakeholders into the design early so they feel invested. Otherwise they'll just ignore your beautiful creation and stick with their crusty Excel files forever. Trust me on that one.
So basically, these dashboards pull all your compliance stuff into one spot where you can actually see what's happening in real-time. Track driver hours, vehicle inspections, hazmat docs - all that fun regulatory stuff. Honestly, the automation part is huge. No more digging through endless spreadsheets when auditors show up (which always feels like the worst timing). It'll automatically flag issues before they become violations and spit out whatever reports DOT or FDA needs. Just set up some alerts for important deadlines and you're golden. Way better than the old manual tracking nightmare.
User feedback is pure gold for your logistics dashboard. Watch how people actually navigate their daily tasks - you'll spot the confusing UI stuff and missing features you never thought of. Different teams care about totally different metrics too. Honestly, the features we think are genius? Users ignore half of them lol. What really matters is seeing the weird workarounds people create when something doesn't work right. Set up regular feedback sessions with your main users. Oh, and make it stupid easy for them to report bugs or issues as they come up.
-
It saves your time and decrease your efforts in half.
-
Nice and innovative design.