

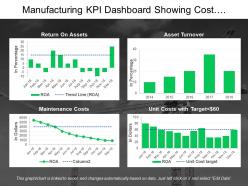
Manufacturing kpi dashboard showing cost management and asset turnover





Try Before you Buy Download Free Sample Product
 Impress Your
Audience
 100%
Editable
 Save Hours
of Time


Experience the creative influence of our Manufacturing Kpi Dashboard Showing Cost Management And Asset Turnover. You will be at your innovative best.
People who downloaded this PowerPoint presentation also viewed the following :
Manufacturing kpi dashboard showing cost management and asset turnover with all 6 slides:
Each time you need to make a presentation make sure it is perfect. Thousands of Manufacturing Kpi Dashboard Showing Cost Management And Asset Turnover are on hand at all hours to make your next pitch a winner.



FAQs for Manufacturing kpi dashboard showing cost management
Essential manufacturing KPIs include overall equipment effectiveness (OEE), production throughput, defect rates, downtime percentages, and cost per unit. These metrics streamline operational visibility by identifying bottlenecks, minimizing waste, and optimizing resource allocation, with many manufacturing organizations finding that comprehensive dashboard tracking ultimately delivers enhanced productivity and significant competitive advantage.
A KPI dashboard helps reduce production costs by providing real-time visibility into waste patterns, equipment efficiency, labor productivity, and resource utilization across manufacturing operations. Through automated monitoring and predictive analytics, manufacturers can identify bottlenecks, minimize downtime, optimize inventory levels, and streamline workflows, ultimately delivering significant cost savings and enhanced operational efficiency.
Real-time data enables manufacturing KPI dashboards to identify bottlenecks, optimize resource allocation, and minimize downtime by providing instant visibility into production metrics, equipment performance, and quality indicators. Through continuous monitoring, manufacturers can respond immediately to production variances, reduce waste, and maintain optimal throughput, with many facilities finding that real-time insights deliver significant cost reductions and enhanced operational efficiency.
Manufacturers can customize KPI dashboards by selecting relevant metrics for their production type, configuring real-time data feeds from equipment sensors, creating role-based views for different departments, and establishing automated alerts for critical thresholds. Through modular dashboard designs, companies streamline monitoring of cycle times, quality rates, and equipment efficiency, while enabling quick decision-making and ultimately delivering improved operational visibility across diverse manufacturing environments.
Manufacturing KPI dashboard best practices include using real-time data feeds, color-coded performance indicators, trend analysis charts, drill-down capabilities, and mobile-responsive design. These visualization approaches streamline decision-making by highlighting critical metrics, enabling quick problem identification, and facilitating proactive responses, with many manufacturing organizations finding that intuitive dashboards ultimately enhance operational efficiency and reduce production downtime.
Predictive analytics integrates into manufacturing KPI dashboards through machine learning algorithms, real-time sensor data analysis, and historical pattern recognition to forecast equipment failures, demand fluctuations, and quality issues. These capabilities enable manufacturers to shift from reactive monitoring to proactive decision-making, ultimately reducing downtime costs and optimizing production schedules before problems occur.
KPI dashboards facilitate decision-making for plant managers by providing real-time visibility into production metrics, equipment performance, quality indicators, and resource utilization in centralized, visual formats. Through automated data integration and predictive analytics, managers can quickly identify bottlenecks, optimize workflows, and allocate resources strategically, ultimately delivering faster response times and improved operational efficiency.
Common pitfalls include overloading dashboards with too many metrics, choosing vanity metrics over actionable KPIs, poor data visualization that obscures insights, lack of real-time integration, and failing to align metrics with strategic objectives. These design flaws ultimately hinder decision-making effectiveness, with many manufacturing organizations finding that focused, role-specific dashboards deliver significantly better operational outcomes and user adoption rates.
Manufacturers ensure data accuracy through automated data collection systems, real-time validation protocols, standardized data entry procedures, regular audits, and integrated ERP connections. These approaches minimize human error, detect anomalies instantly, and maintain consistent reporting standards across production lines, with many facilities finding that automated validation delivers more reliable insights and faster decision-making capabilities.
Manufacturing sustainability metrics include energy consumption per unit, waste reduction percentages, water usage efficiency, carbon footprint measurements, and recycling rates. These indicators enable manufacturers to track environmental performance, reduce operational costs, and meet regulatory compliance requirements, with many organizations finding that comprehensive sustainability dashboards ultimately deliver competitive advantages while enhancing brand reputation in increasingly eco-conscious markets.
Employee productivity gets tracked through metrics like output per worker hour, cycle times, labor efficiency ratios, quality rates, and equipment utilization percentages. These dashboards enable manufacturing managers to identify bottlenecks, optimize workforce allocation, and benchmark performance across different shifts or production lines, ultimately delivering improved operational efficiency and cost reduction.
**INPUT**: What software tools are most effective for creating a manufacturing KPI dashboard? **OUTPUT**: Effective manufacturing KPI dashboard tools include Tableau, Power BI, QlikView, Sisense, and specialized platforms like Epicor and SAP Manufacturing Execution Systems. These solutions streamline real-time data visualization, automated reporting, and cross-departmental integration, with many manufacturers finding that comprehensive dashboards ultimately enhance operational efficiency and accelerate decision-making processes. [Word count: 54 words]
KPI data should be updated daily or weekly for operational metrics like production output and quality rates, while strategic KPIs benefit from monthly or quarterly reviews. Manufacturing organizations increasingly find that real-time dashboards for critical metrics, combined with scheduled review cycles for performance trends, enable faster decision-making, minimize downtime, and ultimately deliver sustained operational efficiency.
Without a KPI dashboard, manufacturing operations face reduced visibility into production metrics, quality control issues, equipment performance, and operational efficiency. This lack of real-time insight leads to delayed problem identification, increased downtime costs, missed production targets, and reactive rather than proactive decision-making, ultimately compromising competitive advantage in an increasingly data-driven manufacturing landscape.
KPI visualizations enhance cross-departmental collaboration by providing shared data transparency, standardized performance metrics, and real-time visibility into interdependent processes. Through centralized dashboards, manufacturing teams can align production schedules with quality targets, procurement with inventory levels, and maintenance with operational efficiency, ultimately breaking down silos and enabling coordinated decision-making across departments.
-
Unique and attractive product design.
-
The Designed Graphic are very professional and classic.