

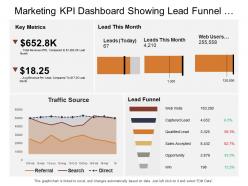
Marketing kpi dashboard snapshot showing lead funnel traffic sources key metrics






Try Before you Buy Download Free Sample Product
 Impress Your
Audience
 100%
Editable
 Save Hours
of Time


Our Marketing Kpi Dashboard Snapshot Showing Lead Funnel Traffic Sources Key Metrics allow you to effectively fill the gaps. It helps identify areas of inexperience.
People who downloaded this PowerPoint presentation also viewed the following :
Marketing kpi dashboard snapshot showing lead funnel traffic sources key metrics with all 6 slides:
Your reputation is precious. Our Marketing Kpi Dashboard Snapshot Showing Lead Funnel Traffic Sources Key Metrics will care for it.


FAQs for Marketing kpi dashboard snapshot showing lead funnel traffic
Essential marketing KPIs include conversion rates, customer acquisition cost, return on ad spend, lead generation metrics, and customer lifetime value. These indicators enable marketing teams to optimize campaigns, allocate budgets strategically, and demonstrate ROI across channels, with many organizations finding that comprehensive dashboards ultimately enhance decision-making and campaign performance.
Businesses can customize their marketing KPI dashboard by selecting metrics that directly correlate with revenue objectives, customer acquisition targets, and brand awareness goals, while incorporating industry-specific performance indicators. Through strategic dashboard configuration, organizations streamline decision-making by tracking conversion rates, customer lifetime value, and campaign ROI, ultimately delivering actionable insights that enhance marketing efficiency and competitive advantage.
Recommended tools for marketing KPI dashboards include Tableau, Power BI, Google Data Studio, HubSpot Analytics, and Salesforce Analytics Cloud, each offering robust visualization capabilities and real-time data integration. These platforms streamline dashboard creation by providing drag-and-drop functionality, customizable templates, and automated reporting features, with many marketing teams finding that interactive dashboards ultimately enhance decision-making speed and campaign optimization across multiple channels.
Marketing KPIs should be reviewed daily for real-time metrics like website traffic and social engagement, weekly for campaign performance and lead generation, and monthly for strategic metrics like customer acquisition costs and ROI. Through automated dashboard updates, marketing teams streamline performance tracking, identify trending opportunities faster, and adjust strategies proactively, ultimately delivering improved campaign effectiveness and competitive advantage.
Organizations ensure marketing KPI dashboard accuracy through automated data integration, regular validation protocols, standardized metrics definitions, and real-time monitoring systems. These approaches streamline data collection from multiple sources, minimize human error, and establish consistent measurement standards, with many marketing teams finding that automated validation and cross-platform integration ultimately delivers more reliable insights and faster decision-making capabilities.
Effective ROI metrics include customer acquisition cost, customer lifetime value, conversion rates, revenue attribution by channel, and cost per lead or sale. These measurements enable organizations to optimize budget allocation across campaigns, identify high-performing channels, and demonstrate marketing's direct contribution to revenue growth, with many companies finding that multi-touch attribution models provide the most comprehensive ROI insights.
A marketing KPI dashboard helps identify trends by consolidating campaign performance, customer acquisition costs, conversion rates, and engagement metrics into visual formats that reveal patterns over time. Through real-time analytics and comparative reporting, marketing teams can quickly spot emerging opportunities, optimize underperforming channels, and allocate budgets strategically, ultimately delivering improved ROI and more targeted campaigns.
Best practices for marketing KPI dashboard visualization include using clear hierarchical layouts, consistent color coding, interactive filtering options, real-time data integration, and intuitive chart selections that match data types. These approaches streamline decision-making by enabling quick pattern recognition, reducing cognitive load, and facilitating cross-channel performance comparisons, with many marketing teams finding that strategic visual design ultimately delivers faster insights and enhanced campaign optimization capabilities.
Cross-channel marketing efforts can be analyzed through comprehensive KPI dashboards that track customer journey mapping, attribution modeling, conversion rates, engagement metrics, and ROI across all touchpoints. These dashboards streamline performance evaluation by consolidating data from email, social media, paid advertising, and organic channels, enabling marketers to optimize budget allocation and ultimately deliver improved campaign effectiveness.
Customer engagement metrics serve as vital indicators of audience connection and campaign resonance, measuring interactions like social media engagement, email open rates, website dwell time, content shares, and click-through rates. These metrics enable marketing teams to assess content effectiveness, optimize channel strategies, and predict customer lifetime value, with many organizations finding that strong engagement correlates directly with improved conversion rates and brand loyalty.
Customer journey mapping enhances marketing KPI analysis by connecting performance metrics to specific touchpoints, revealing where prospects convert, drop off, or engage most effectively across channels. This strategic combination enables businesses to optimize resource allocation, personalize customer experiences, and identify high-impact moments, with many organizations finding significantly improved conversion rates and marketing ROI.
Common implementation challenges include data integration complexities, selecting relevant KPIs, ensuring team adoption, maintaining data accuracy, and establishing clear reporting processes. Organizations overcome these obstacles by starting with core metrics, investing in proper training, implementing gradual rollouts, and regularly reviewing dashboard effectiveness, with many finding that phased approaches and stakeholder involvement ultimately deliver better user engagement and more actionable insights.
Seasonality and external factors significantly influence marketing KPI interpretation by creating fluctuations in metrics like conversion rates, customer acquisition costs, and engagement levels that may not reflect campaign performance. Retail businesses experience holiday spikes, while B2B companies see summer slowdowns, making year-over-year comparisons and trend normalization essential for accurate performance assessment and strategic decision-making.
Common pitfalls include tracking too many metrics without clear priorities, choosing vanity metrics over actionable KPIs, poor data visualization that obscures insights, and lack of regular review processes. Many marketing teams find that overcomplicated dashboards, misaligned stakeholder expectations, and failure to connect metrics to business objectives ultimately undermine decision-making effectiveness and strategic goal achievement.
Shared marketing KPI dashboards enhance team collaboration by providing real-time visibility into campaign performance, enabling synchronized decision-making, and eliminating data silos across departments. Through centralized metrics access, marketing teams can coordinate strategies more effectively, sales teams align their efforts with lead quality insights, and executives make informed resource decisions, ultimately delivering improved campaign outcomes and faster response times to market opportunities.
-
Designs have enough space to add content.
-
Editable templates with innovative design and color combination.