

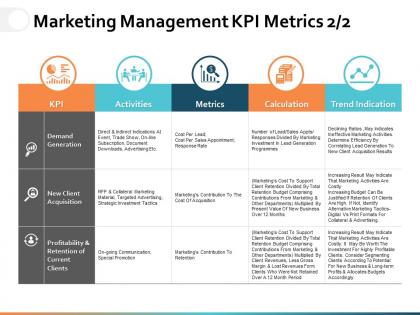
Marketing management kpi metrics ppt powerpoint presentation file graphics tutorials





Try Before you Buy Download Free Sample Product
 Impress Your
Audience
 100%
Editable
 Save Hours
of Time


Establish command over core areas with our Marketing Management KPI Metrics Ppt Powerpoint Presentation File Graphics Tutorials. Gain control over critical domains.
People who downloaded this PowerPoint presentation also viewed the following :
Marketing management kpi metrics ppt powerpoint presentation file graphics tutorials with all 5 slides:
Display your flair for business with our Marketing Management KPI Metrics Ppt Powerpoint Presentation File Graphics Tutorials. Convince them you have the acumen.


FAQs for Marketing management kpi metrics ppt powerpoint presentation
Honestly, conversion rate and CPA are your bread and butter - they show if people actually buy stuff or just window shop. ROAS is huge too since it tells you if you're making money. Click-through rates matter, but don't obsess over them. Time on page and social shares are weirdly good at predicting who'll convert later. Lifetime customer value is clutch because sometimes expensive customers are totally worth it if they stick around. I'd say track maybe 5-6 metrics max - any more and you'll drown in spreadsheets. Pick what matches your goals and ignore the rest.
Honestly, start with what you actually want to accomplish - brand awareness, lead gen, keeping customers around? That part matters way more than people think. Then match your KPIs to that goal instead of just picking whatever sounds impressive. Awareness campaigns? Track reach and share of voice. Lead generation? Cost per lead and conversion rates are your friends. Don't go crazy with metrics - maybe 3-5 tops or you'll get buried in spreadsheets. Pick stuff your team can actually move the needle on and understands how to improve. Those vanity metrics everyone obsesses over? Skip them.
CAC is your go-to metric for figuring out how much you're spending to get each new customer. Just take your total marketing spend and divide by new customers acquired that month. The math has to work out - if you're spending more to acquire someone than they'll ever pay you back, you're screwed. I track mine monthly and always compare it to lifetime value. Honestly, most companies mess this up by not looking at it by channel. You want to see which marketing efforts actually pay off so you can shift budget around. It's pretty straightforward but super telling about whether your growth is sustainable or just expensive.
Honestly, conversion rates are like the ultimate BS detector for your marketing. Sure, you might get crazy traffic and people liking your posts, but are they actually buying anything? That's what matters. I've seen so many campaigns that look amazing on paper but convert terribly. Track where people drop off in your funnel - maybe they love your ad but hate your landing page, you know? Don't get caught up in vanity metrics. Focus on what actually moves the needle and gets people to take action.
Honestly, engagement rate should be your top priority - that's what shows if people actually give a damn about your content vs just scrolling past it. Click-through rates matter too since you want to drive traffic somewhere useful. Conversion rate is obviously huge because, well, likes don't pay rent lol. I'd also watch your follower growth and overall reach for the bigger picture stuff. Oh and if you're in a super competitive niche, share of voice can be pretty telling. Start there, then add platform-specific things like story completion rates depending on where your people actually hang out most.
Dude, CLV completely changes your marketing game. Instead of chasing quick conversions, you start thinking long-term relationships. Like, if one customer's worth $500 over two years versus another's $50, suddenly you can justify spending way more to get and keep the valuable ones. Budget allocation becomes so much clearer. You'll end up personalizing campaigns for your high-value segments while automating the cheaper touchpoints for everyone else. Honestly, most people skip this step but it's huge. Start by calculating CLV for your main customer groups, then rebuild your whole strategy around maximizing that lifetime value.
Yeah, so different channels need totally different KPIs because they work so differently. Digital's easy - you've got click-through rates, conversions, cost per acquisition, all that real-time stuff. Print though? That's where it gets weird. You're stuck using coupon codes, special URLs, maybe some brand surveys. Events are attendance rates, lead quality, cost per lead - but honestly, event ROI is such a pain to figure out sometimes. Oh, and don't try forcing the same metrics on everything. Each channel does its own thing, so measure what actually matters for that specific channel. Makes way more sense that way.
Honestly, just get dashboards that update every 15-30 minutes so you're not refreshing like a maniac. Pick 3-5 metrics that actually matter - revenue pipeline, conversion rates, customer acquisition cost, campaign ROI. Those are usually the big ones. Google Analytics Real-Time works great, or HubSpot if you've got it. The game-changer is setting alerts for when numbers hit specific thresholds (good or terrible). Don't overthink the tool situation though - master one dashboard platform first. I made the mistake of trying three different ones at once and it was chaos.
Look, most teams get totally sidetracked by vanity metrics that look pretty in dashboards but mean nothing for actual revenue. You want to map your KPIs straight to what matters - customer acquisition cost, lifetime value, stuff that actually impacts your bottom line. Every quarter, sit down with leadership and figure out which metrics are genuinely moving the business forward. Honestly, half the KPIs I see companies track are just noise. Cut anything that doesn't clearly connect to growth or whatever your main goals are. It's brutal but necessary - those quarterly check-ins will save you from chasing the wrong numbers.
ROMI shows you if your marketing dollars are actually making money back. For every buck you spend, how much revenue comes in? Getting $5 back for each $1 invested means you're crushing it. Way better than tracking likes or impressions - that stuff doesn't pay the bills. Executives love ROMI because it connects campaigns directly to real business results. Honestly saved my ass during budget cuts last year. Track it by channel though, so you can see which ones are winners and ditch the losers. It's one of those metrics that actually matters.
Honestly, you've gotta turn that fuzzy stuff into actual numbers. Brand awareness? Run surveys with 1-10 rating scales or use social listening tools to count unprompted mentions. Same deal with customer satisfaction - NPS scores, CSAT ratings, even sentiment analysis from reviews. The key is doing it consistently so you can spot patterns. I'd do monthly brand surveys and maybe quarterly satisfaction deep-dives. Then connect those dots with your hard numbers like revenue or retention. That's how you'll figure out what's actually working. It sounds like a lot but it's pretty straightforward once you get going.
Oh man, data fragmentation is gonna drive you insane. Everything's split between Google Analytics, social dashboards, email platforms - none of it syncs up right. Attribution is a total mess too when customers hit multiple touchpoints before converting. Plus your stakeholders will cherry-pick whatever numbers make them look good (classic). Here's what actually works: nail down 3-5 KPIs that connect to real revenue. Get everyone on the same page about definitions first - trust me on this. Then grab a solid dashboard tool to pull it all together. Way less headache than juggling ten different reports.
Dude, you're probably drowning in spreadsheets right now. Tools like HubSpot or Marketo will automate all that manual data pulling - they track email opens, conversions, the whole thing automatically. Google Analytics and Tableau are solid for dashboards too. I spent way too much time fighting with Excel before I figured this out. Real-time tracking means you're analyzing what matters instead of just collecting numbers all day. Pick one platform that works with your main channels first. Don't try to do everything at once or you'll go crazy.
Honestly, A/B testing is a game-changer for figuring out if your KPIs are actually meaningful or just pretty numbers on a dashboard. Split-test your campaigns, messaging, whatever - then watch how it affects conversion rates, CAC, all that stuff. No more sitting around debating whether to change email subject lines. Just test it! Half your audience gets version A, half gets B, boom - you've got real data instead of office politics deciding strategy. I always tell people to test one thing at a time though, otherwise you can't tell what actually moved the needle. Way less stressful than guessing.
Check your KPIs monthly and actually do something about what you see. Rising customer acquisition costs plus dropping conversions? Time to test new channels or switch up your messaging. Engagement tanking might mean your content's getting stale or your audience is moving on - happens all the time. I've watched teams ignore this stuff for way too long and blow through their budget. The trick is setting up reviews where you don't just look at numbers but make real action plans. Short sentences work. Monthly check-ins keep you from missing major shifts that'll kill your ROI.
No Reviews