


Monthly KPI Tracker To Measure Content Marketing Success





Try Before you Buy Download Free Sample Product
 Impress Your
Audience
 100%
Editable
 Save Hours
of Time


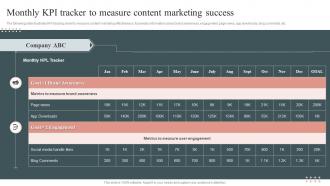
The following slide illustrates KPI tracking sheet to measure content marketing effectiveness. It provides information about brand awareness, engagement, page views, app downloads, blog comments, etc.
People who downloaded this PowerPoint presentation also viewed the following :
Monthly KPI Tracker To Measure Content Marketing Success with all 6 slides:
Use our Monthly KPI Tracker To Measure Content Marketing Success to effectively help you save your valuable time. They are readymade to fit into any presentation structure.





FAQs for Monthly KPI Tracker To Measure
Honestly, it depends on your industry but some basics work everywhere. Revenue growth, customer acquisition cost, and lifetime value are must-haves - they show if you're actually making money and keeping customers around. Don't forget profit margins (seriously, so many people ignore this). Cash flow's critical too. For the day-to-day stuff, employee turnover and customer satisfaction scores matter. Here's the thing though - pick maybe 5-7 max that actually connect to your goals. I've seen too many companies track everything and use nothing. Better to watch fewer metrics consistently than drown in spreadsheets you never look at.
Honestly, less is more with these things. Pick charts that tell the story instantly - trend lines for tracking performance, progress bars for hitting targets, basic bar charts for comparing stuff. Green means good, red means bad. People get that immediately. Don't dump everything on one slide though, you'll lose them. One KPI per visual works way better. Make the actual numbers big and obvious next to your chart. Oh, and always add a quick note explaining what it means and what you're doing about it. Sounds obvious but half the dashboards I see skip that part.
Honestly depends what you're trying to track and how much you wanna spend. Google Sheets is probably your best bet to start - it's free and does the job. Excel works too if you've got it already. Once you figure out what metrics actually matter (took me forever to narrow mine down), then maybe look at Power BI or Tableau for the fancy stuff. Notion's weirdly good at this too, which I didn't expect. There are dedicated KPI tools like Klipfolio and Geckoboard that integrate with everything, but they cost more. I'd definitely start simple with Sheets first though.
Weekly updates work best for me, though daily's even better if you're not lazy about it. I tried doing mine monthly before and honestly? Half the data was useless by the time I looked at it. Daily feels like overkill unless you're tracking something super time-sensitive. Set up a calendar reminder - mine's Monday mornings because I'm already caffeinated and slightly motivated. The consistency matters more than being perfect about it. You'll catch problems way faster than waiting a whole month, and it doesn't turn into this massive dreaded task.
Honestly, most people mess this up by tracking way too many things at once. Stick to 3-5 KPIs max or you'll drown in data. Skip the vanity metrics too - like yeah, 10k Instagram followers sounds cool, but does it actually help your business? Be specific instead of vague ("improve customer satisfaction" tells you nothing useful). Don't get married to your metrics either. I review mine every quarter because priorities shift. Oh, and work backwards from what actually moves the needle for revenue or growth - that's your starting point.
Honestly, most teams I know track way too much useless stuff that just looks good in presentations. Here's what actually works: connect every single metric to a real business goal - no exceptions. Can't make that connection? Drop it immediately. Leading indicators beat lagging ones every time since they actually help you steer the ship instead of just telling you where you've been. Make sure your KPIs flow down logically from company goals to departments to individuals. Oh, and review quarterly but be brutal about cutting anything that isn't changing how people make decisions.
So leading KPIs show you what's *going* to happen - stuff like how many calls your sales team made or website traffic. Lagging ones tell you what already went down, like actual revenue or how happy customers were after the fact. I always think of it like... leading indicators are your speedometer warning you're about to get a ticket, while lagging ones are the ticket itself lol. You want both though. Leading KPIs help you fix things before they break. Lagging ones show if your fixes actually worked or if you're still screwing up.
Run workshops with your team to figure out what metrics actually matter day-to-day. Have everyone brainstorm 3-5 outcomes that'd make the biggest difference for customers or business. People buy into KPIs way more when they help create them instead of getting targets dumped on them from leadership (learned this the hard way). Let them suggest realistic targets using historical data and current capacity. Assign ownership so everyone feels responsible for specific metrics. Document who's tracking what and do weekly check-ins together. Keeps everyone engaged and honestly makes your job easier too.
Look, each KPI needs to connect to stuff you can actually change. Can't do anything when the numbers tank? Wrong metric. Someone should own each one - I've watched way too many beautiful dashboards collect dust because nobody's accountable. Ask yourself: "if this shifted tomorrow, what would we do?" No clear answer means you either need a different KPI or a solid action plan. Short bursts work better than long ones for review sessions. The whole point is making decisions, not admiring spreadsheets.
Honestly, most teams are drowning in metrics they don't even use. Pick 3-5 KPIs that actually connect to revenue or your biggest goals - that's it. Your leadership should be looking at these regularly and making real decisions from them, not just nodding along in meetings. Also think about how much work each one takes to track. I've seen people spend hours pulling data that nobody acts on anyway. Quick trick: make a simple chart with business impact on one side, effort on the other. Go for the high-impact stuff that doesn't require you to become a data analyst. Some metrics look important but they're just vanity numbers, you know?
You gotta pick KPIs based on your industry, obviously. Retail folks should track conversion rates, average order value, inventory turnover - the usual suspects. SaaS is all about monthly recurring revenue, churn, and customer acquisition costs. Manufacturing gets into OEE, defect rates, cycle times. Healthcare's where it gets messy though - patient satisfaction, readmission rates, plus a bunch of other stuff that'll make your head spin. Don't go crazy tracking everything. Pick like 3-5 that actually move the needle for your business. Whatever keeps your boss happy, you know?
Make that KPI tracker public so everyone can see the numbers. Regular team check-ins work best - have people actually review their metrics together instead of keeping it all secret. Once people realize their performance gets discussed openly, they usually start caring more about hitting their targets. But here's the thing - don't just collect data for the sake of it. You gotta act on what you're seeing. Be clear about what "good" looks like for each metric. Call people out (nicely) when they're slipping. Honestly, the best part is when they start monitoring themselves because they know it matters.
Dude, benchmarking is what stops you from celebrating garbage numbers. Like, you might think a 5% conversion rate rocks until you find out everyone else is hitting 15%. Yikes. Compare yourself to industry standards, competitors, or your old performance - whatever makes sense for your size and market. Otherwise you're just staring at random numbers with zero context. Pick 2-3 solid benchmarks for your biggest KPIs first. Trust me, it'll save you from those awkward moments where you realize you've been patting yourself on the back for mediocre results.
Tell the story behind your data instead of just throwing numbers at people. Charts and visuals help a ton - makes trends super obvious. I made this mistake early on, sending these massive spreadsheets that literally no one opened lol. Your audience matters too. Executives want the big picture and business impact, but team leads need the nitty-gritty operational stuff. Always explain what caused the changes and your next steps. Oh, and make it interactive! Don't just present - ask questions and keep the conversation going. Way better than talking at people for 30 minutes straight.
Charts and colors are your best friends here - make everything visual so people actually get it at a glance. Honestly, I'd stick to maybe 5-7 metrics tops because more than that and everyone's eyes just glaze over. Group similar stuff together and throw in some quick context about what the numbers actually mean for your goals. Oh, and please keep the data fresh - nobody wants to look at numbers from forever ago. Start with your biggest metric first, then add the supporting details underneath. That way you're telling an actual story instead of just throwing random data at people.
-
“I always have a wonderful experience with SlideTeam. It's my ""go to"" when I need a template.”
-
Loved the fact that SlideTeam provides clean, high-definition, and professional PowerPoint products.