

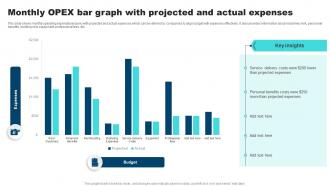
Monthly OPEX Bar Graph With Projected And Actual Expenses





Try Before you Buy Download Free Sample Product
 Impress Your
Audience
 100%
Editable
 Save Hours
of Time


This slide shows monthly operating expenditure opex with projected and actual expenses which can be referred by companies to align budget with expenses effectively. It also provides information about machinery rent, personnel benefits, building rent, equipment, professional fees, etc.
People who downloaded this PowerPoint presentation also viewed the following :
Monthly OPEX Bar Graph With Projected And Actual Expenses with all 7 slides:
Use our Monthly OPEX Bar Graph With Projected And Actual Expenses to effectively help you save your valuable time. They are readymade to fit into any presentation structure.






FAQs for Monthly OPEX Bar Graph With Projected
A monthly OPEX analysis report should include personnel costs, utilities and facilities expenses, technology and software subscriptions, marketing expenditures, and departmental operational costs. These components enable organizations to track spending patterns, identify cost optimization opportunities, and benchmark performance against budgets, with many companies finding that comprehensive monthly analysis streamlines resource allocation and enhances financial control.
Businesses can effectively track operating expenses through automated expense management systems, standardized cost centers, real-time financial dashboards, and consistent categorization frameworks that align with industry standards. These approaches streamline data collection, enhance visibility into spending patterns, and enable accurate budget variance analysis, with many organizations finding that systematic expense tracking reduces operational costs by 15-20% while improving financial decision-making capabilities.
**INPUT**: What are the most common challenges organizations face when performing monthly OPEX analysis? **OUTPUT**: Common OPEX analysis challenges include data fragmentation across departments, inconsistent categorization methods, manual reconciliation processes, delayed vendor invoicing, and limited real-time visibility into spending patterns. These obstacles streamline decision-making by creating reporting delays, reducing cost control accuracy, and hampering budget forecasting capabilities, with many finance teams finding that automated tracking systems ultimately deliver enhanced spending transparency and faster monthly closure cycles. [Word count: 60 words]
Monthly OPEX analysis influences strategic financial planning by identifying cost trends, operational inefficiencies, and resource allocation opportunities that directly impact budget forecasting and capital allocation decisions. Through detailed expense tracking, organizations can optimize departmental spending, anticipate seasonal variations, and reallocate resources toward growth initiatives, ultimately delivering improved profit margins and strategic competitive positioning.
Recommended tools for monthly OPEX analysis include enterprise resource planning systems like SAP and Oracle, financial management platforms such as NetSuite and QuickBooks Enterprise, and specialized spend analytics software like Coupa and Procurify. These solutions streamline data collection, automate expense categorization, and provide real-time reporting capabilities, with many organizations finding that integrated dashboards deliver enhanced visibility and faster decision-making.
Variances in monthly OPEX reveal cost reduction opportunities by highlighting departments exceeding budgets, identifying seasonal spending patterns, and uncovering inefficient resource allocation across operations. Through detailed variance analysis, organizations can pinpoint unnecessary expenditures, renegotiate vendor contracts, and streamline processes, with many companies finding that consistent monitoring ultimately delivers 10-15% operational savings.
Historical data serves as the foundation for forecasting future operating expenses by revealing seasonal patterns, cost trends, expense volatility, and correlation relationships between different cost categories. Through statistical analysis and trend modeling, organizations can identify recurring expense cycles, anticipate budget variances, and develop more accurate financial projections, ultimately enabling better resource allocation and strategic planning decisions.
Companies benchmark OPEX against industry standards through financial databases like S&P Capital IQ, industry association reports, and peer analysis using comparable metrics such as OPEX-to-revenue ratios and cost per unit. This strategic comparison enables organizations to identify efficiency gaps, optimize resource allocation, and implement best practices from top performers, ultimately delivering competitive advantages and improved operational margins.
**INPUT**: What metrics are essential for evaluating the efficiency of operational spending? **OUTPUT**: Essential metrics include cost-per-unit ratios, operational efficiency percentages, budget variance analysis, resource utilization rates, and return on operational investment measurements. These indicators streamline financial oversight by identifying spending patterns, benchmarking performance against industry standards, and optimizing resource allocation, with many organizations finding that systematic tracking ultimately delivers enhanced profitability and competitive operational advantage. [Word count: 58 words]
Monthly OPEX analysis supports resource allocation decisions by identifying spending patterns, cost inefficiencies, and budget variances across departments and projects. This detailed financial visibility enables organizations to reallocate funds from underperforming areas to high-impact initiatives, optimize staffing levels, and prioritize investments, ultimately delivering improved operational efficiency and strategic resource deployment.
Not conducting regular monthly OPEX analysis leads to cost overruns, budget misalignment, inefficient resource allocation, and delayed identification of financial irregularities or operational inefficiencies. Organizations miss opportunities for strategic cost optimization and risk management, with many companies finding that inconsistent expense monitoring ultimately results in reduced profitability and compromised competitive positioning.
Visual aids and presentation templates enhance OPEX communication by transforming complex financial data into digestible charts, graphs, and dashboards that stakeholders can quickly understand and act upon. These tools streamline reporting processes, ensure consistent messaging across departments, and enable faster decision-making, with many organizations finding that visual presentations reduce meeting times while increasing stakeholder engagement and buy-in for cost optimization initiatives.
Cross-functional teams bring diverse perspectives, specialized knowledge, and comprehensive insights that ensure OPEX analysis captures all operational dimensions and cost drivers across departments. This collaborative approach enhances accuracy by identifying hidden inefficiencies, facilitates better buy-in for cost reduction initiatives, and enables more strategic resource allocation, with many organizations finding that cross-departmental involvement ultimately delivers more actionable insights and sustainable operational improvements.
Companies ensure compliance during OPEX analysis by implementing standardized reporting frameworks, maintaining detailed audit trails, and conducting regular regulatory reviews with qualified financial professionals. Through automated compliance monitoring systems, organizations streamline documentation requirements, enhance transparency across operational expenditures, and minimize regulatory risks, with many financial institutions finding that systematic compliance protocols ultimately deliver faster approvals and stronger stakeholder confidence.
After identifying trends or anomalies in monthly OPEX reports, organizations should conduct root cause analysis, validate data accuracy, engage relevant department heads for explanations, and develop corrective action plans with specific timelines. These investigations enable companies to address cost overruns, optimize resource allocation, and implement preventive measures, ultimately delivering improved financial control and operational efficiency across departments.
-
“I required a slide for a board meeting and was so satisfied with the final result !! So much went into designing the slide and the communication was amazing! Can’t wait to have my next slide!”
-
I really liked their customized design services. I got my desired template made by their expert team. Thank You!