

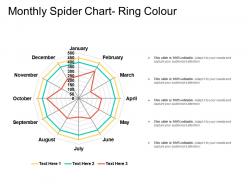
Monthly spider chart ring colour





Try Before you Buy Download Free Sample Product
 Impress Your
Audience
 100%
Editable
 Save Hours
of Time


Introducing our impressive monthly spider chart design PowerPoint template. After plotting the values for each month, use this regular spider grid layout to compare the whole year for a single or multiple variables. This monthly spider diagram creative PPT set will also help you in showcasing the key insights and statistics for each month in accordance with the process under analysis. Accommodate this cyclical web graph polar PPT layout to compare and analyze multifactor data. Employ this monthly radar chart PowerPoint deck to map the progress, compare the expenditure, and show benefits of different areas like departments, processes, products, categories, and much more. Utilize this monthly star illustration PowerPoint set to present valuable information in a comprehensive manner. This web chart design PowerPoint design will assist you in comparing data of different business quarters, observing patterns, and presenting effective solutions to break patterns. Inclusive of five different slides, assimilate it instantly to make sure your data is presented in a systematic manner.
People who downloaded this PowerPoint presentation also viewed the following :
Monthly spider chart ring colour with all 5 slides:
Your thoughts will glow with our Monthly Spider Chart Ring Colour. Create a halo around your thoughts.


FAQs for Monthly spider
Different colors in spider charts trigger distinct psychological responses that significantly influence data interpretation, with red suggesting urgency or poor performance, blue conveying trust and stability, and green indicating success or growth. These color associations can unconsciously bias viewers' perceptions, with many organizations finding that strategic color choices enhance comprehension and decision-making, while poor color selection may mislead audiences regardless of actual data accuracy.
Color gradients enhance spider chart clarity by creating visual hierarchies that distinguish variable performance levels, highlight patterns across multiple datasets, and guide viewer attention to critical insights. Through strategic gradient application, organizations streamline data interpretation, enable faster comparative analysis between departments or time periods, and ultimately deliver more intuitive presentations that stakeholders can quickly understand and act upon.
**INPUT**: What are the best color combinations for ensuring accessibility in spider charts for color-blind individuals? **OUTPUT**: Accessible spider chart color combinations include high-contrast palettes using blues with oranges, purples with yellows, and distinct saturations that avoid red-green conflicts. These strategic color choices enhance data comprehension by ensuring clarity across diverse audiences, pattern differentiation through brightness variations, and inclusive visualization experiences, ultimately delivering broader stakeholder engagement and more effective business presentations.
Cultural perceptions significantly influence spider chart interpretation, as colors carry different meanings across societies—red signifies danger in Western cultures but prosperity in Chinese culture, while green represents growth globally but has negative connotations in some regions. Organizations increasingly customize color schemes for international audiences, with financial institutions and healthcare providers finding that culturally-appropriate palettes enhance data comprehension and decision-making accuracy.
Color saturation serves as a visual hierarchy tool in spider charts, with highly saturated colors drawing immediate attention to critical metrics while muted tones represent secondary data points. This strategic approach enables organizations to highlight performance gaps, competitive advantages, or priority areas, with many businesses finding that selective saturation enhances decision-making speed and focus during presentations.
Contrasting colors significantly enhance spider chart legibility by creating clear visual separation between multiple data series, reducing cognitive load, and enabling audiences to quickly distinguish between different metrics or categories. Strategic color combinations, such as pairing dark blues with bright oranges or using complementary schemes, allow viewers to track individual data points across complex polygons while maintaining focus during presentations, ultimately delivering clearer insights and more effective data storytelling.
**INPUT**: What strategies can be employed to maintain visual balance in spider charts with multiple colored axes? **OUTPUT**: Visual balance strategies include using complementary color palettes, maintaining consistent saturation levels, alternating warm and cool tones, and ensuring adequate contrast between adjacent axes. These approaches streamline data interpretation by reducing visual clutter, enhancing readability, and creating intuitive navigation patterns, with many analysts finding that balanced color distribution ultimately delivers clearer insights and more effective stakeholder presentations. [Word count: 60]
Color-coded legends streamline spider chart interpretation by creating intuitive visual connections between data series and their corresponding plot lines, enabling viewers to quickly identify, compare, and analyze multiple variables simultaneously. Through strategic color assignments and clear legend positioning, organizations can enhance data comprehension, reduce interpretation errors, and facilitate faster decision-making processes, ultimately delivering more impactful presentations and stakeholder communications.
Monochromatic color schemes in spider charts offer visual cohesion, reduced cognitive load, and professional aesthetic appeal, while presenting challenges in data differentiation, accessibility for colorblind users, and potential viewer engagement. This approach works well for single-dataset presentations or corporate branding requirements, with many organizations finding that strategic accent variations within the monochromatic palette enhance clarity while maintaining visual consistency.
Industries strategically use spider chart colors to enhance data interpretation, with healthcare employing red for critical metrics and green for positive outcomes, finance using blue for stability indicators and orange for risk factors, and manufacturing applying color gradients to show performance ranges. These color conventions enable quick visual assessment, improve decision-making speed, and ensure consistent communication across teams, ultimately delivering clearer insights and more effective presentations.
Several tools provide extensive color customization for spider charts, including Microsoft Excel, Tableau, Power BI, Google Charts, and specialized platforms like SlideTeam's presentation templates. These solutions enable organizations to align visualizations with brand guidelines, enhance data readability, and create professional presentations, with many businesses finding that consistent color schemes across analytics dashboards ultimately strengthen stakeholder engagement and decision-making processes.
Effective spider chart colors significantly enhance audience engagement by improving readability, creating visual hierarchy, and enabling quick pattern recognition across multiple data dimensions. Strategic color combinations help presenters highlight key performance areas, differentiate between datasets, and guide audience attention to critical insights, with many organizations finding that well-designed color schemes increase information retention and facilitate more productive discussions during strategic presentations.
Best practices for spider chart colors include using distinct hues for each data series, maintaining consistent color coding across related charts, applying high contrast combinations for accessibility, and limiting the palette to 5-7 colors maximum to avoid visual confusion. These color strategies enhance data comprehension by enabling quick pattern recognition, facilitating comparative analysis between dimensions, and ensuring clarity in presentations, with many organizations finding that strategic color application significantly improves stakeholder understanding and decision-making speed.
Thematic color choices enhance spider chart storytelling by creating emotional connections, reinforcing brand identity, establishing visual hierarchies, and guiding audience focus toward key insights. Through strategic color palettes, organizations can transform complex multi-dimensional data into compelling narratives, with sectors like marketing, healthcare, and consulting finding that cohesive color themes significantly improve audience engagement and data comprehension rates.
Color choices in spider charts significantly impact professional presentation aesthetics through brand consistency, data hierarchy establishment, accessibility considerations, and audience engagement levels. Strategic color selection enhances credibility by ensuring readability across different viewing environments, maintaining corporate visual standards, and facilitating clear data interpretation, with many organizations finding that thoughtful color palettes ultimately deliver stronger stakeholder communication and more persuasive business outcomes.
-
Out of the box and creative design.
-
Great product with highly impressive and engaging designs.