Multiple construction project features chart with remarks
Our Multiple Construction Project Features Chart With Remarks are topically designed to provide an attractive backdrop to any subject. Use them to look like a presentation pro.
- Google Slides is a new FREE Presentation software from Google.
- All our content is 100% compatible with Google Slides.
- Just download our designs, and upload them to Google Slides and they will work automatically.
- Amaze your audience with SlideTeam and Google Slides.
-
Want Changes to This PPT Slide? Check out our Presentation Design Services
- WideScreen Aspect ratio is becoming a very popular format. When you download this product, the downloaded ZIP will contain this product in both standard and widescreen format.
-

- Some older products that we have may only be in standard format, but they can easily be converted to widescreen.
- To do this, please open the SlideTeam product in Powerpoint, and go to
- Design ( On the top bar) -> Page Setup -> and select "On-screen Show (16:9)” in the drop down for "Slides Sized for".
- The slide or theme will change to widescreen, and all graphics will adjust automatically. You can similarly convert our content to any other desired screen aspect ratio.
Compatible With Google Slides

Get This In WideScreen
You must be logged in to download this presentation.
PowerPoint presentation slides
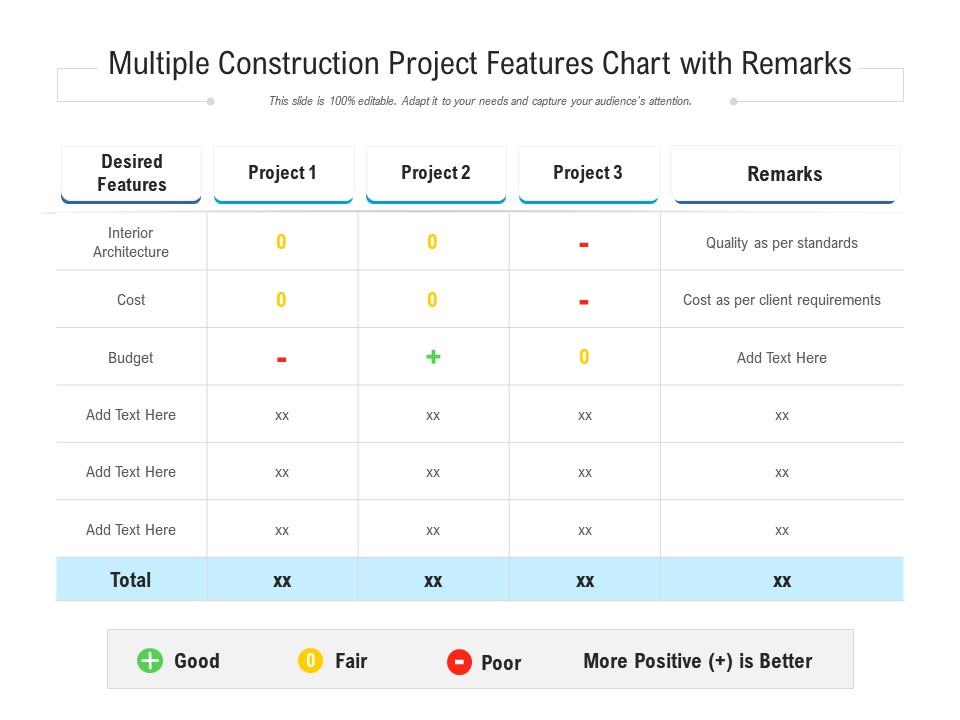
Introducing our Multiple Construction Project Features Chart With Remarks set of slides. The topics discussed in these slides are Interior Architecture, Cost, Budget, More Positive, Project, Good, Poor, Fair. This is an immediately available PowerPoint presentation that can be conveniently customized. Download it and convince your audience.
People who downloaded this PowerPoint presentation also viewed the following :
Content of this Powerpoint Presentation
Description:
The image showcases a "Multiple Construction Project Features Chart with Remarks," which serves as a comparative analysis tool for different projects. This editable slide is designed to adapt to specific presentation needs and is intended to capture the audience's attention. The chart is structured into five main columns:
1. Desired Features:
This section outlines the criteria or features to be assessed, including Interior Architecture, Cost, Budget, and three customizable rows labeled "Add Text Here."
2. Project 1 and Project 2:
In these columns, assessments are indicated by symbols: a green plus sign for positive assessments, a yellow circle for fair assessments, and a red minus sign for poor assessments. Placeholder text marked as "xx" is provided for specific data.
3. Project 3:
This column is reserved for the assessment of a third project, although it has not been assessed in the example.
4. Remarks:
The Remarks column provides comments related to the assessments. It includes additional customizable text areas for specific remarks and explanations.
At the bottom of the slide, a legend is provided to explain the meaning of the symbols: a green plus sign represents "Good," a yellow circle represents "Fair," and a red minus sign represents "Poor." A statement emphasizes that "More Positive (+) is Better."
Use Cases:
This versatile slide can be applied in various industries for comparative analysis, ranking, or status reporting purposes. Here are seven industries and their specific use cases:
1. Construction:
Use: Comparison of different construction projects.
Presenter: Project Manager.
Audience: Investors or Stakeholders.
2. Real Estate Development:
Use: Evaluating the features of various development projects.
Presenter: Real Estate Developer.
Audience: Clients or Partners.
3. Project Management Consultancy:
Use: Presenting project performance reviews to clients.
Presenter: Consultant.
Audience: Client Management Team.
4. Manufacturing:
Use: Analyzing features of multiple product designs.
Presenter: Product Manager.
Audience: Executive Leadership Team.
5. Information Technology:
Use: Assessing various software development projects.
Presenter: IT Manager.
Audience: Project Sponsors.
6. Education:
Use: Comparing curricular or extracurricular program initiatives.
Presenter: Education Coordinator.
Audience: School Board or Committee.
7. Energy and Utilities:
Use: Evaluating infrastructure or energy projects on different parameters.
Presenter: Energy Analyst.
Audience: Regulatory Bodies or Government Officials.
Multiple construction project features chart with remarks with all 2 slides:
Use our Multiple Construction Project Features Chart With Remarks to effectively help you save your valuable time. They are readymade to fit into any presentation structure.
-
Informative design.
-
Use of icon with content is very relateable, informative and appealing.
-
Top Quality presentations that are easily editable.


