


Net promoter score powerpoint images




Try Before you Buy Download Free Sample Product
 Impress Your
 Audience
 100%
100% Editable
 Save Hours
 of Time


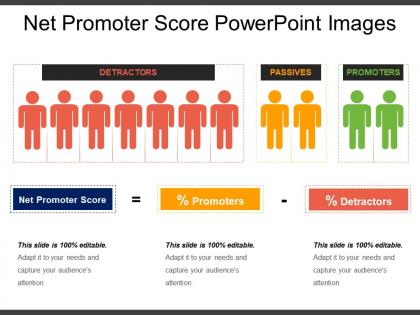
The net promoter score PowerPoint slide is an outstanding management presentation tool to measure loyalty of an organization’s customers. The net promoter score PPT template presents an alternative methodology to the traditional as well as lengthy customer satisfaction research process. Apart from customers or client's loyalty, a user can use the net promoter score designs slide to analyze the employee's loyalty as well. You can use the net promoter score component template for PowerPoint to highlight that NPS for employee engagement has basically four driving components such as commitment, connection, contribution, and challenges. The net promoter score image slide design shows that these four components drive engagement as well as overall employee satisfaction (NPS). It plays a vital role to motivate or demotivate the employees. The employee net promoter score slide for PowerPoint presentation describes NPS is basically a single question survey technique to assess likability of company, product or services, etc. The net promoter score design PPT template is useful for illustrating the three outcomes of NPS calculation such as promoters, passive, and detractors. Furthermore, you can display the retention as well as referral percentage of employees. Battle fluctuating circumstances with our Net Promoter Score Powerpoint Images. End the existence of instability.
People who downloaded this PowerPoint presentation also viewed the following :
Net promoter score powerpoint images with all 5 slides:
Encourage intelligent debate with our Net Promoter Score Powerpoint Images. Get folks to indulge in beneficial discussions.

FAQs for Net promoter
The Net Promoter Score (NPS) measures customer loyalty and satisfaction by determining how likely customers are to recommend a company's products or services to others. It's calculated by subtracting the percentage of detractors (scores 0-6) from promoters (scores 9-10), with many organizations finding that this streamlines customer feedback analysis, enables targeted retention strategies, and ultimately delivers actionable insights for improving customer experiences and driving sustainable growth.
Businesses can effectively gather NPS feedback through email surveys, in-app prompts, post-purchase questionnaires, SMS campaigns, and website pop-ups strategically timed after key customer interactions. These touchpoints enable organizations to capture authentic sentiment across multiple channels, with many companies finding that combining automated triggers with personalized follow-ups delivers higher response rates and more actionable insights.
Common NPS interpretation pitfalls include focusing solely on the score without understanding underlying feedback, comparing scores across different industries or customer segments inappropriately, and making hasty decisions based on short-term fluctuations. Organizations should analyze qualitative comments alongside quantitative data, benchmark against relevant peers, and track trends over time, with many companies finding that contextual analysis delivers more actionable insights than raw scores alone.
NPS scores drive customer loyalty and retention strategies by identifying promoters for advocacy programs, addressing detractor concerns through targeted interventions, and segmenting customers based on satisfaction levels. These insights enable organizations to personalize retention efforts, prioritize service improvements, and develop targeted campaigns, with many companies finding that NPS-driven strategies significantly enhance customer lifetime value and reduce churn rates.
Employee engagement significantly influences NPS by directly impacting customer interactions, service quality, and brand representation across all touchpoints. Engaged employees deliver more personalized experiences, resolve issues proactively, and demonstrate genuine enthusiasm that resonates with customers, with many organizations finding that higher employee satisfaction scores correlate strongly with improved customer loyalty and advocacy ratings.
Companies leverage NPS data by analyzing feedback patterns, segmenting detractors by demographics and touchpoints, and correlating scores with specific customer journey stages. Through targeted analysis, organizations identify operational bottlenecks, service gaps, and product limitations, while prioritizing improvements based on impact potential, ultimately transforming criticism into strategic roadmaps for enhanced customer experiences.
NPS demonstrates strong correlations with key business performance metrics, including revenue growth, customer retention rates, market share expansion, and profitability indicators. Companies with higher NPS scores typically experience increased customer lifetime value, reduced acquisition costs, and enhanced operational efficiency, with many organizations finding that improving NPS by even small margins translates into measurable competitive advantage and sustained financial growth.
Businesses should measure NPS quarterly for most industries, though customer-facing sectors like retail and hospitality benefit from monthly tracking to capture seasonal variations and rapid service changes. This frequency enables organizations to identify trends, respond to feedback systematically, and implement improvements while maintaining statistical reliability, ultimately delivering actionable insights without survey fatigue.
Best practices include timely responses within 24-48 hours, personalized acknowledgments addressing specific concerns, and clear action plans for resolving issues raised by detractors. These follow-up strategies enhance customer relationships by demonstrating genuine commitment to improvement, converting detractors into promoters, and reinforcing loyalty among advocates, ultimately delivering higher retention rates and stronger brand reputation.
NPS measures customer loyalty and likelihood to recommend, while CSAT gauges satisfaction with specific interactions and CES evaluates effort required to resolve issues. These metrics work strategically together, with retail companies using CSAT for transaction feedback, CES for support processes, and NPS for long-term relationship health, ultimately delivering comprehensive customer experience insights.
Visual presentations enhance NPS communication through interactive dashboards, trend charts, segmentation heatmaps, score comparisons, and customer journey mapping. These visualization tools streamline complex data interpretation by highlighting key patterns, enabling stakeholder alignment, and facilitating actionable insights, with many organizations finding that visual NPS reporting accelerates decision-making and drives targeted customer experience improvements.
Businesses can benchmark their NPS by researching industry-specific surveys, consulting specialized analytics firms like Bain & Company, and analyzing competitor performance through customer experience platforms. These approaches enable organizations to understand their relative market position, identify improvement opportunities, and set realistic targets, with many companies finding that industry context transforms raw NPS data into actionable strategic insights.
Effective NPS improvement strategies include enhancing customer service training, implementing feedback loop systems, personalizing customer experiences, streamlining complaint resolution processes, and regularly surveying customer satisfaction touchpoints. These approaches work by addressing pain points proactively, building stronger relationships, and creating consistent positive interactions, with many organizations finding that systematic feedback implementation and employee engagement ultimately deliver higher loyalty scores and competitive advantage.
NPS insights inform product development by identifying specific pain points, feature gaps, and user experience friction through detractor feedback, while promoter insights reveal what drives customer loyalty and satisfaction. These data-driven inputs enable development teams to prioritize features that address core issues, enhance beloved functionalities, and innovate solutions that transform detractors into advocates, ultimately delivering products with stronger market fit.
NPS tools include SurveyMonkey, Qualtrics, Delighted, AskNicely, and Medallia, which streamline survey distribution, response collection, and detailed analytics. These platforms enhance customer feedback management by automating survey workflows, providing real-time dashboards, and delivering actionable insights, with many organizations finding that integrated NPS software significantly improves response rates and strategic decision-making capabilities.
-
Nice and innovative design.
-
Easily Understandable slides.