

Net Promoter Score Powerpoint PPT Template Bundles





Try Before you Buy Download Free Sample Product
 Impress Your
Audience
 100%
Editable
 Save Hours
of Time


Our Net Promoter Score Powerpoint PPT Template Bundles are topically designed to provide an attractive backdrop to any subject. Use them to look like a presentation pro.
People who downloaded this PowerPoint presentation also viewed the following :
Net Promoter Score Powerpoint PPT Template Bundles with all 22 slides:
Use our Net Promoter Score Powerpoint PPT Template Bundles to effectively help you save your valuable time. They are readymade to fit into any presentation structure.










FAQs for Net Promoter Score Powerpoint
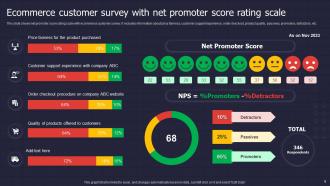
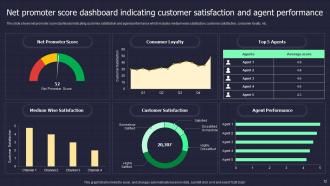
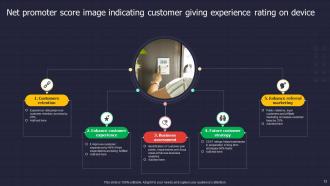
Net Promoter Score (NPS) is a customer loyalty metric that measures how likely customers are to recommend a company to others, calculated by subtracting the percentage of detractors (scores 0-6) from promoters (scores 9-10). This strategic measurement enables businesses across retail, financial services, and healthcare to quantify customer satisfaction, identify improvement opportunities, and ultimately enhance customer retention while gaining competitive advantage through actionable loyalty insights.
Businesses can effectively implement NPS surveys through strategic timing, multi-channel distribution, simplified question formats, automated follow-ups, and segmented customer targeting. By deploying surveys post-purchase, after support interactions, and quarterly via email, SMS, and in-app notifications, companies streamline feedback collection while enhancing response rates, ultimately delivering actionable insights that drive customer retention and competitive advantage.
NPS measures loyalty through recommendation likelihood, while CSAT evaluates satisfaction with specific interactions and CES assesses effort required to resolve issues. These metrics work together strategically, with retail companies finding that combining NPS's long-term loyalty insights with CSAT's immediate feedback and CES's friction identification ultimately delivers comprehensive customer experience optimization and competitive advantage.
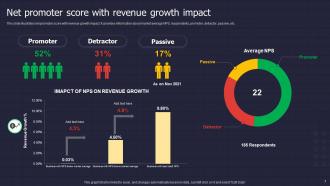
NPS data informs business strategy by identifying customer loyalty trends, predicting revenue growth, and highlighting operational improvements needed across touchpoints. Companies use these insights to prioritize resource allocation, guide product development decisions, and benchmark against competitors, with many organizations finding that consistent NPS tracking ultimately delivers enhanced customer retention and sustainable competitive advantage.
Common NPS interpretation pitfalls include focusing solely on the score without understanding underlying reasons, comparing scores across different industries or timeframes inappropriately, and ignoring sample size limitations. These challenges can be avoided by conducting follow-up qualitative research, benchmarking against industry-specific standards, and ensuring statistically significant sample sizes, ultimately delivering more actionable insights for strategic decision-making.
Businesses should measure NPS quarterly for comprehensive insights, with many organizations supplementing this with monthly pulse surveys for faster feedback loops. This strategic combination enables companies to track long-term satisfaction trends while quickly identifying emerging issues, ultimately delivering more responsive customer experiences and competitive advantage in increasingly dynamic markets.
Employee engagement significantly impacts NPS by directly influencing customer interactions, service quality, and overall brand experience through motivated staff delivering superior customer care, proactive problem-solving, and genuine enthusiasm. Engaged employees in sectors like retail, hospitality, and financial services consistently create positive customer touchpoints, with many organizations finding that companies with highly engaged workforces achieve NPS scores 12-18 points higher than competitors.
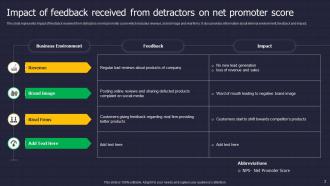
Organizations can target detractors by conducting follow-up surveys to identify specific pain points, implementing personalized outreach campaigns, and creating dedicated resolution teams to address individual concerns. Through targeted interventions like exclusive offers, priority customer service, and systematic feedback loops, companies in retail and financial services often convert detractors into promoters, ultimately improving overall NPS scores and customer loyalty.
Best practices for following up with customers after collecting NPS feedback include closing the feedback loop with personalized responses, addressing detractors' concerns promptly, thanking promoters for their loyalty, and implementing changes based on feedback patterns. These approaches enhance customer relationships by demonstrating responsiveness, building trust through transparent communication, and ultimately improving retention rates, with many organizations finding that systematic follow-up transforms feedback into competitive advantage.
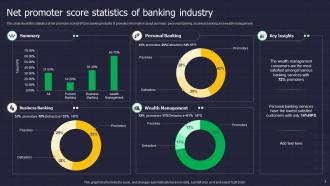
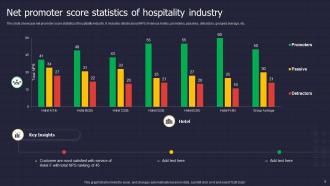
NPS varies significantly across industries, with retail and hospitality typically achieving scores of 50-70, while utilities and telecommunications often see 10-30 due to limited customer choice. Companies should benchmark against industry peers rather than universal standards, with many organizations finding that consistent improvement trends matter more than absolute scores, ultimately delivering better customer retention and competitive positioning.
Companies can encourage NPS survey responses through personalized invitations, optimal timing after key interactions, mobile-friendly formats, incentive programs, and clear communication about survey purpose and duration. Financial services and retail organizations increasingly find that combining multiple touchpoints, offering small rewards like discounts, and demonstrating how feedback drives improvements significantly boosts participation rates, ultimately delivering richer customer insights and enhanced satisfaction tracking.
Companies transform NPS insights into actionable marketing strategies by segmenting promoters for referral campaigns, addressing detractor concerns through targeted messaging, and leveraging feedback themes for content creation. Through systematic analysis, organizations develop personalized retention programs, enhance value propositions, and create advocacy-driven campaigns, with many finding that NPS-informed strategies significantly improve customer acquisition costs and lifetime value.
Promoters are NPS respondents scoring 9-10 who actively recommend your brand, driving organic growth through word-of-mouth marketing, repeat purchases, and customer referrals. These loyal advocates typically generate significantly higher lifetime value, lower acquisition costs, and sustainable revenue streams, with many organizations finding that increasing promoter percentages directly correlates with improved market share and competitive advantage.
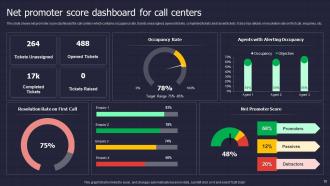
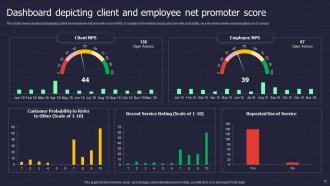
Technology enhances NPS tracking through automated survey distribution, real-time data collection, advanced analytics platforms, and integrated dashboard reporting. These tools streamline feedback gathering by enabling instant responses, predictive analytics, and sentiment analysis, with many organizations finding that automated systems deliver faster insights, improved response rates, and actionable customer intelligence for strategic decision-making.
Future NPS trends include AI-powered sentiment analysis, real-time feedback integration, predictive analytics for customer churn, multi-channel experience tracking, and automated response systems. These technologies enhance measurement accuracy by streamlining data collection, personalizing customer interactions, and enabling proactive retention strategies, with many organizations finding that integrated approaches deliver significantly improved customer loyalty and competitive advantage.
-
Visually stunning presentation, love the content.
-
Excellent work done on template design and graphics.