

One page construction project gantt chart presentation report infographic ppt pdf document
This document titled One Page Construction Project Gantt Chart Presentation Report Infographic PPT PDF Document is an A4 size template designed in Powerpoint and is 100 percent editable. It displays the details in a crisp clear and digestible format while also being visually appealing. With this document you will be able to provide a comprehensive view to your audience with minimal effort. One Page Construction Project Gantt Chart Presentation Report Infographic PPT PDF Document will save you precious time and help you communicate your message with your viewers.
This document titled One Page Construction Project Gantt Chart Presentation Report Infographic PPT PDF Document is an A4 si..


You must be logged in to download this presentation.


Do you want to remove this product from your favourites?
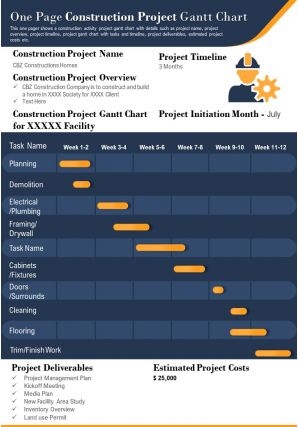
Here we present One Page Construction Project Gantt Chart Presentation Report Infographic PPT PDF Document one pager PowerPoint template. Map out your project schedule by taking the assistance of this one pager Gantt chart PowerPoint template. This creatively designed Project schedule chart one pager can be utilized for launching a website and for keeping a track on the progress of the activities. Display the new website name company name and the date of website launch. It helps you breakdown the project right from the beginning till the end. You will not only be able to manage the projects efficiently but will be able to organize it in a way that can be easily understood by your employees. Weekly progress can be monitored and detect the bottlenecks in the projects. Figure out the things that are creating the hinderance in the way of completing the project and devise strategies to overcome the same. The graphical illustration of the project will help you engage your audience and mark the areas that need more attention. Talk about the website launch marketing list testing procedure and display the estimated cost by downloading this project milestone chart PowerPoint one pager. Grab this One Page Construction Project Gantt Chart Presentation Report Infographic PPT PDF Document one pager template now.
One page construction project gantt chart presentation report infographic ppt pdf document with all 2 slides:
Use our One Page Construction Project Gantt Chart Presentation Report Infographic PPT PDF Document to effectively help you save your valuable time. They are readymade to fit into any presentation structure.
FAQ’s for Reports
- What kinds of reports do you offer?
- Can I change the default layout of these reports?
- Are these reports shareable with my executives?
- Can these reports accommodate large amounts of data?
- I have a few sets of data that are to be converted into reports? Can you create customized reports from that data?
- I need a hard copy of my report. How do I get one?
- How do I save my business report?
- In which kind of format can I save my reports?
What kinds of reports do you offer?
We have a huge collection of reports on various topics, both personal and professional. These report templates cater to every domain making them useful for every individual or organization that downloads it. For more information feel free to browse through our collection and select the designs that excite you!
Can I change the default layout of these reports?
These reports are sample representations that are Excel linked. Useful content has been added to make them look more presentable. However, they come in a fully editable format, so, all the default charts, graphs, etc. used in these templates can be modified to fit your needs and aspirations.
Are these reports shareable with my executives?
Yes, these reports can be exported and shared with others as they come in a downloadable format. Simply download the file, save it in the format of your choice, and share it with other members. The formats we offer are PNG, PDF, JPG, PPT, and Google Slides, making the exporting process convenient for the end-user.
Can these reports accommodate large amounts of data?
Any amount of data can be imported to these reports. The design and layout will adjust itself according to the data added, making the information presented easy to retain and reinforce itself.
I have a few sets of data that are to be converted into reports? Can you create customized reports from that data?
We offer custom design services, for which you can get in touch with our SlideTeam design professionals at [email protected]. They will help in transforming your data into valuable and informative report sets. Consequently, you can also download a few sample reports from our gallery and custom-tailor them according to your needs.
I need a hard copy of my report. How do I get one?
Simply, login to your account, open the report of your choice and click on the “Download this Report” button. A zip folder will be downloaded. Extract the files and save it in the format of choice like PNG, JPG, PPT, PDF, etc. These files can be easily converted into hard copies.
How do I save my business report?
Simply click on the “Download this Report” button to save the reports for further application. Downloading the reports will give you access to save it, update it, and share it as per your liking.
In which kind of format can I save my reports?
The reports can be saved and exported in various formats like PNG, PDF, PPT, JPG, and Google Slides. You can keep these folders in your system for as long as you like and use them for multiple projects.
