Operational intelligence powerpoint presentation slides
Give an overview of business intelligence by utilizing these Operational Intelligence PowerPoint Presentation Slides. Our readily available presentation contains various templates explaining market overview, architecture framework, data design, and integration Display BI design, advanced final output results, KPI metrics, and dashboards through this content-ready PowerPoint slide deck. This commercial intelligence presentation aptly showcases how BI assists in developing business. Display valuable business insights with the help of our professionally designed corporate intelligence PPT slideshow. Depict other important information like industries that use BI and critical drivers with the help of our visually appealing artificial intelligence PPT slide deck. Take the assistance of industrial AI PPT layouts to demonstrate sophisticated subjects like information architecture and dimensional modeling easily. You can convey your BI design and implementation compactly with our handy business intelligence PowerPoint diagrams. Shed light on advanced analytics techniques and methods by utilizing our integrated business planning PPT theme. Download the artificial intelligence PowerPoint slideshow to represent your plan to expand business horizons.
Give an overview of business intelligence by utilizing these Operational Intelligence PowerPoint Presentation Slides. Our r..
- Google Slides is a new FREE Presentation software from Google.
- All our content is 100% compatible with Google Slides.
- Just download our designs, and upload them to Google Slides and they will work automatically.
- Amaze your audience with SlideTeam and Google Slides.
-
Want Changes to This PPT Slide? Check out our Presentation Design Services
- WideScreen Aspect ratio is becoming a very popular format. When you download this product, the downloaded ZIP will contain this product in both standard and widescreen format.
-

- Some older products that we have may only be in standard format, but they can easily be converted to widescreen.
- To do this, please open the SlideTeam product in Powerpoint, and go to
- Design ( On the top bar) -> Page Setup -> and select "On-screen Show (16:9)” in the drop down for "Slides Sized for".
- The slide or theme will change to widescreen, and all graphics will adjust automatically. You can similarly convert our content to any other desired screen aspect ratio.
Compatible With Google Slides

Get This In WideScreen
You must be logged in to download this presentation.
PowerPoint presentation slides
This complete deck can be used to present to your team. It has PPT slides on various topics highlighting all the core areas of your business needs. This complete deck focuses on Operational Intelligence Powerpoint Presentation Slides and has professionally designed templates with suitable visuals and appropriate content. This deck consists of total of fifty eight slides. All the slides are completely customizable for your convenience. You can change the colour, text and font size of these templates. You can add or delete the content if needed. Get access to this professionally designed complete presentation by clicking the download button below.
People who downloaded this PowerPoint presentation also viewed the following :
Content of this Powerpoint Presentation
Slide 1: This slide introduces Operational Intelligence. State Your Company Name and begin.
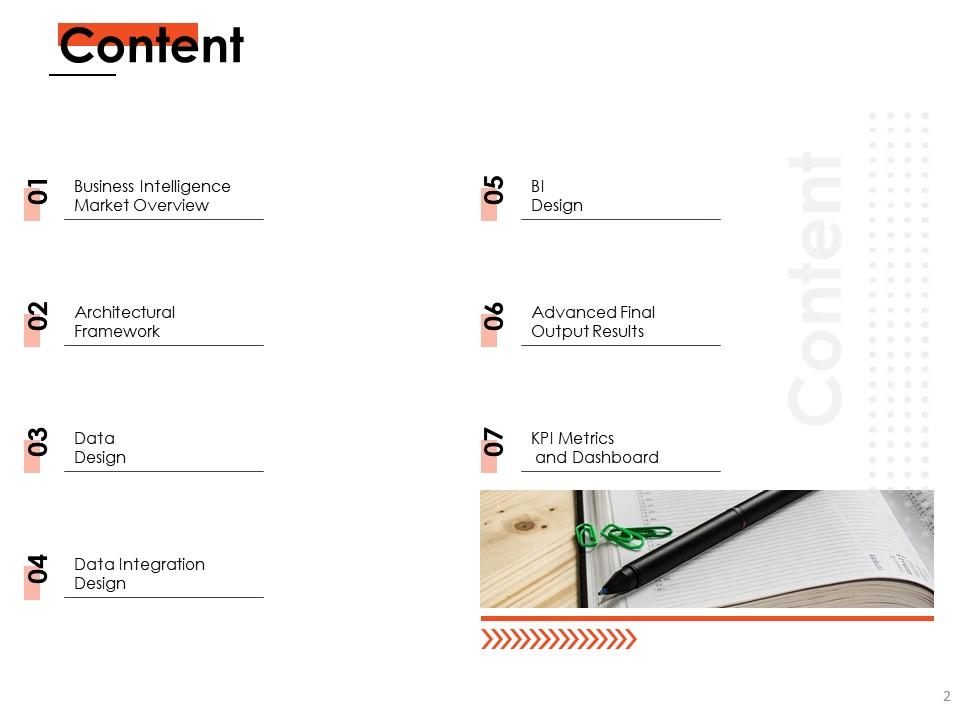
Slide 2: This slide shows Content describing- Business Intelligence Market Overview, Architectural Framework, Data Design, etc.
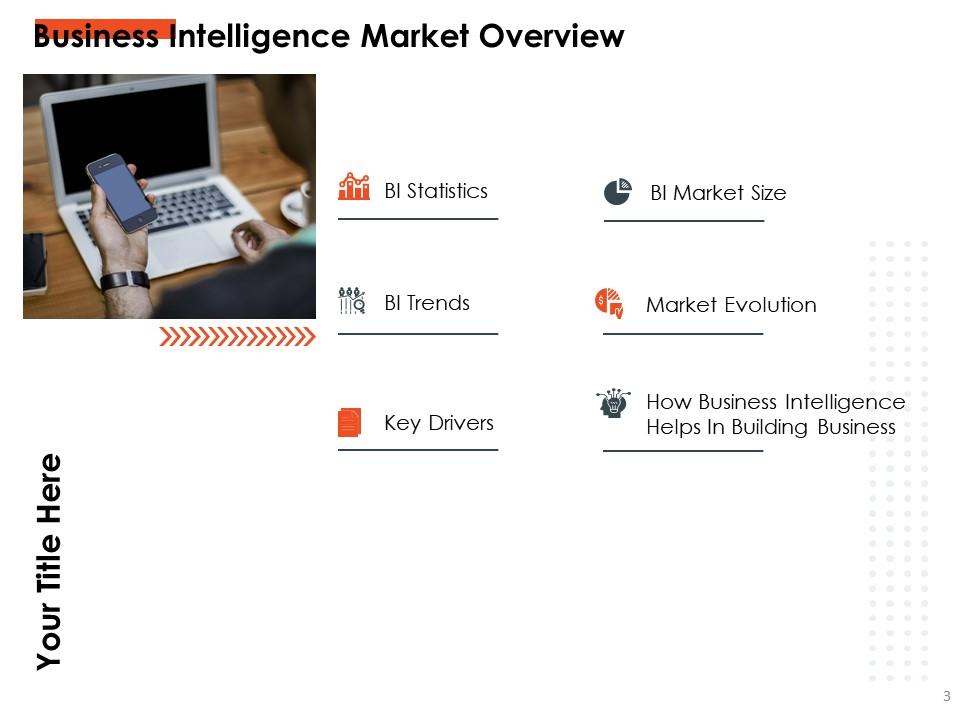
Slide 3: This slide presents Business Intelligence Market Overview describing- Market Evolution, BI Trends, Key Drivers, etc.
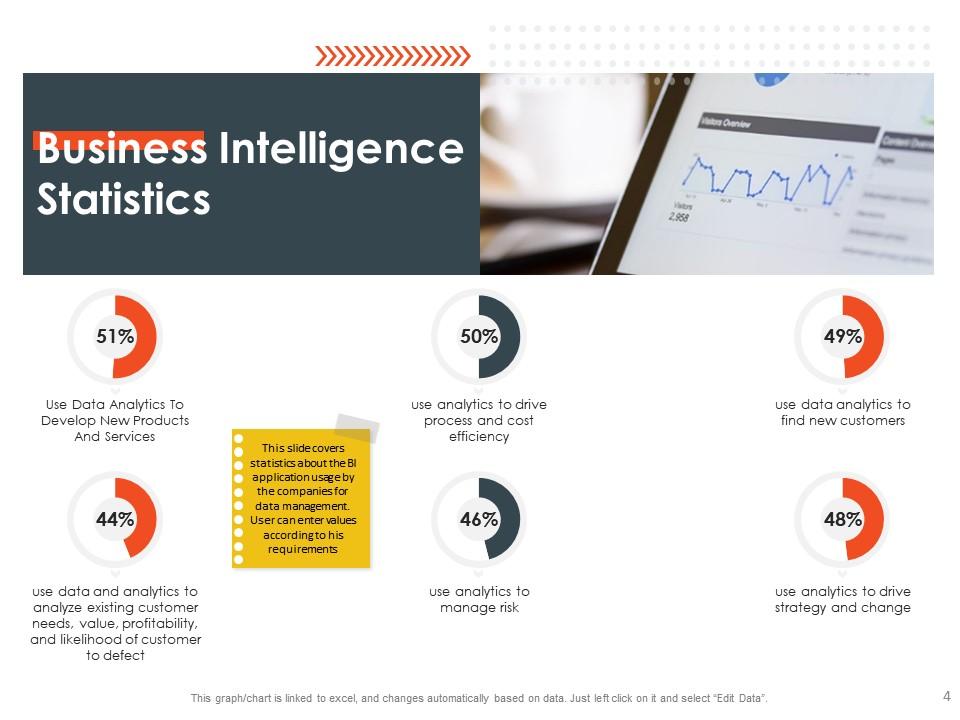
Slide 4: This slide displays Business Intelligence Statistics BI application usage by the companies for data management.
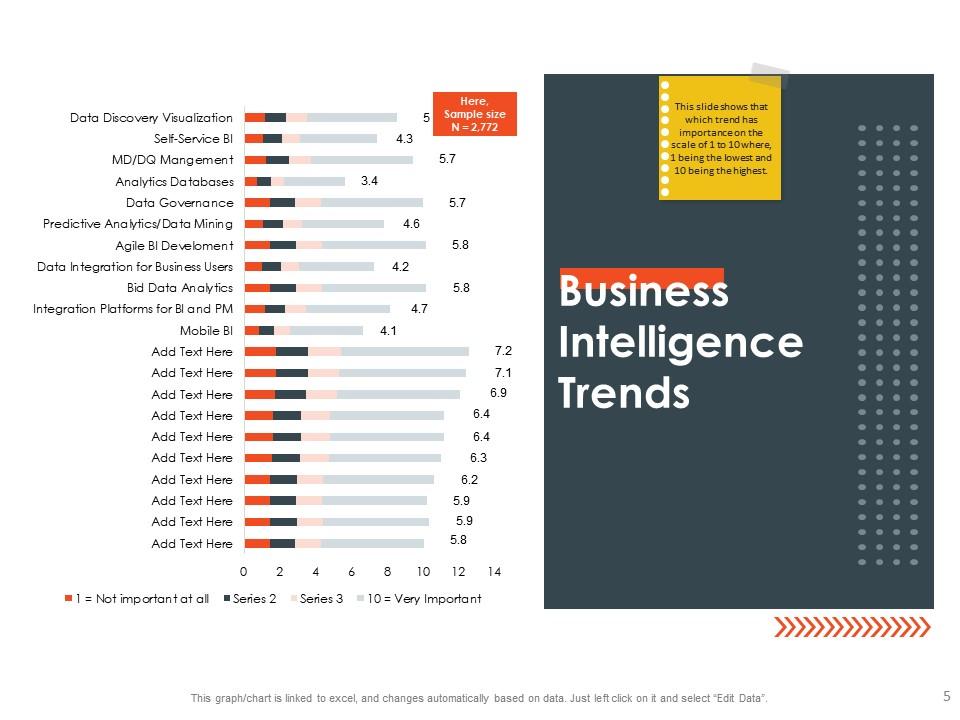
Slide 5: This slide represents Business Intelligence Trends describing importance on the scale of 1 to 10.
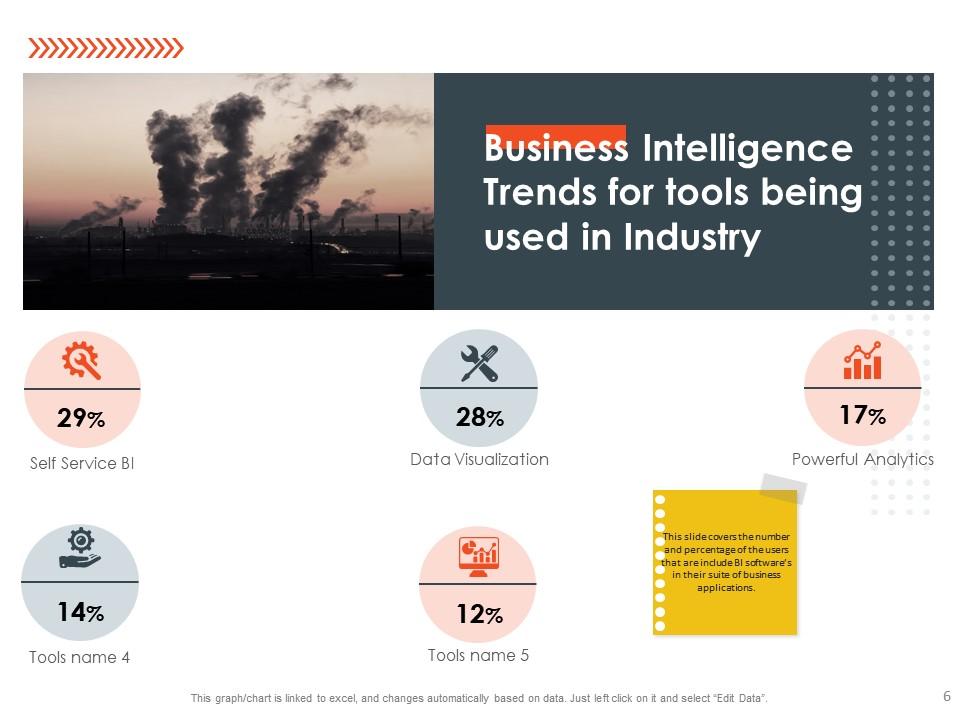
Slide 6: This slide showcases Business Intelligence Trends for tools being used in Industry.
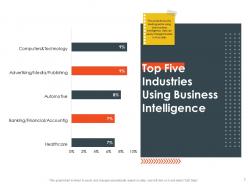
Slide 7: This slide shows Top Five Industries Using Business Intelligence with the help of bar graph.
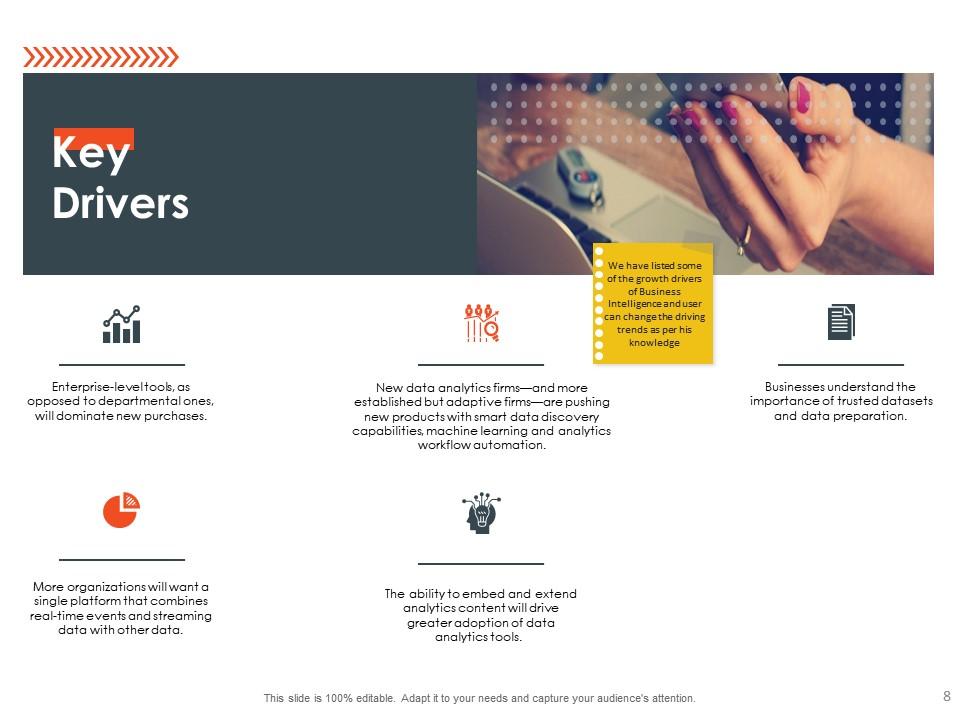
Slide 8: This slide shows Key Drivers describing some of the growth drivers of Business Intelligence.
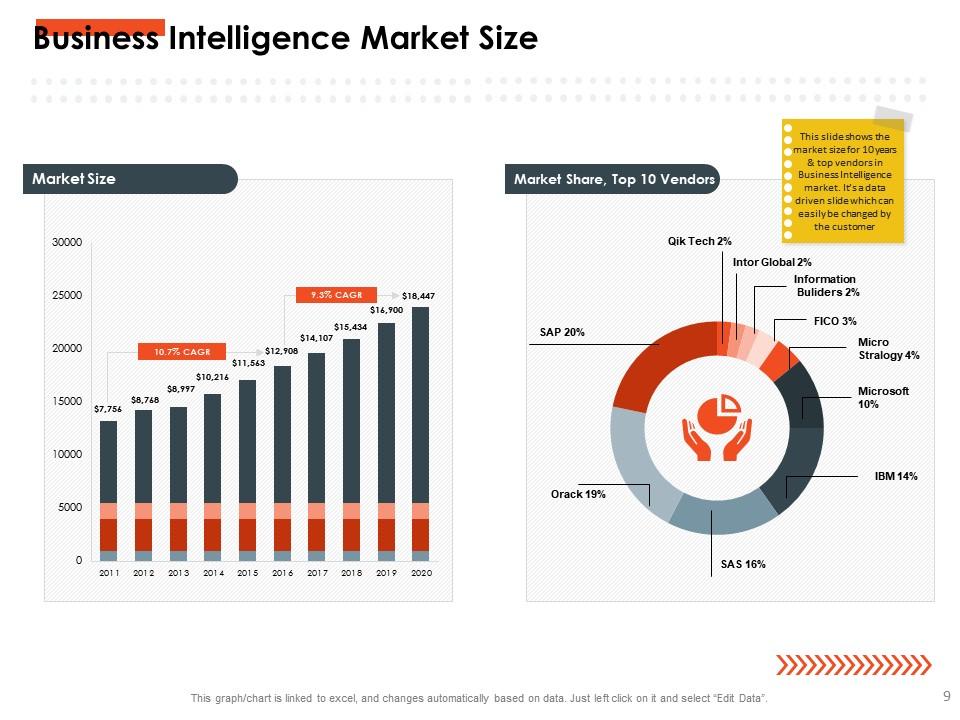
Slide 9: This slide presents Business Intelligence Market Size describing market size for 10 years & top vendors in Business Intelligence market.
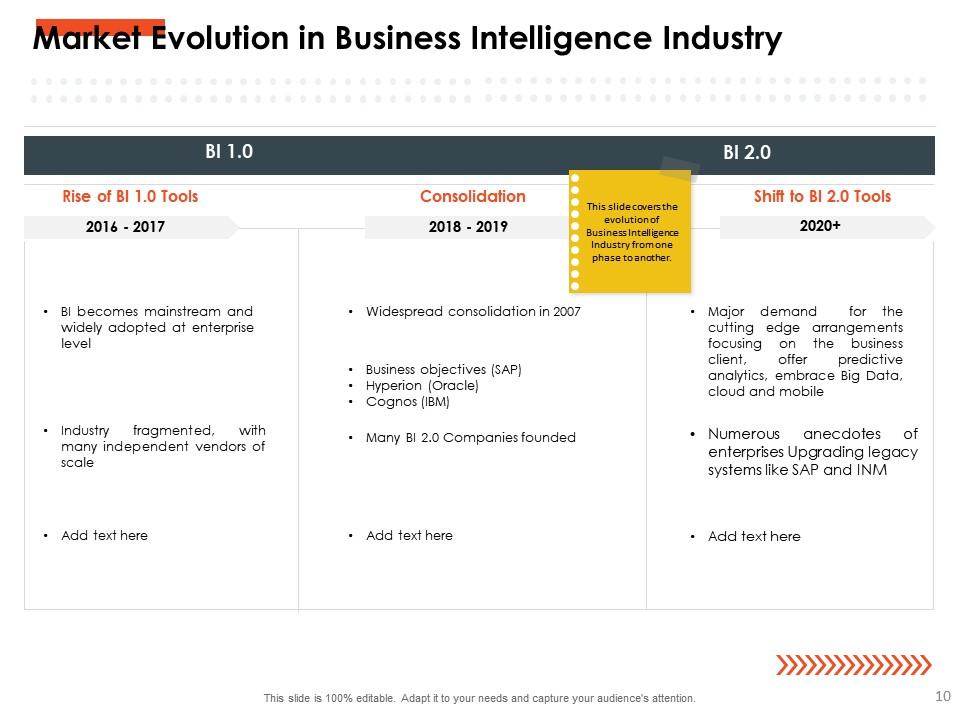
Slide 10: This slide displays Market Evolution in Business Intelligence Industry covering the evolution of Business Intelligence Industry from one phase to another.
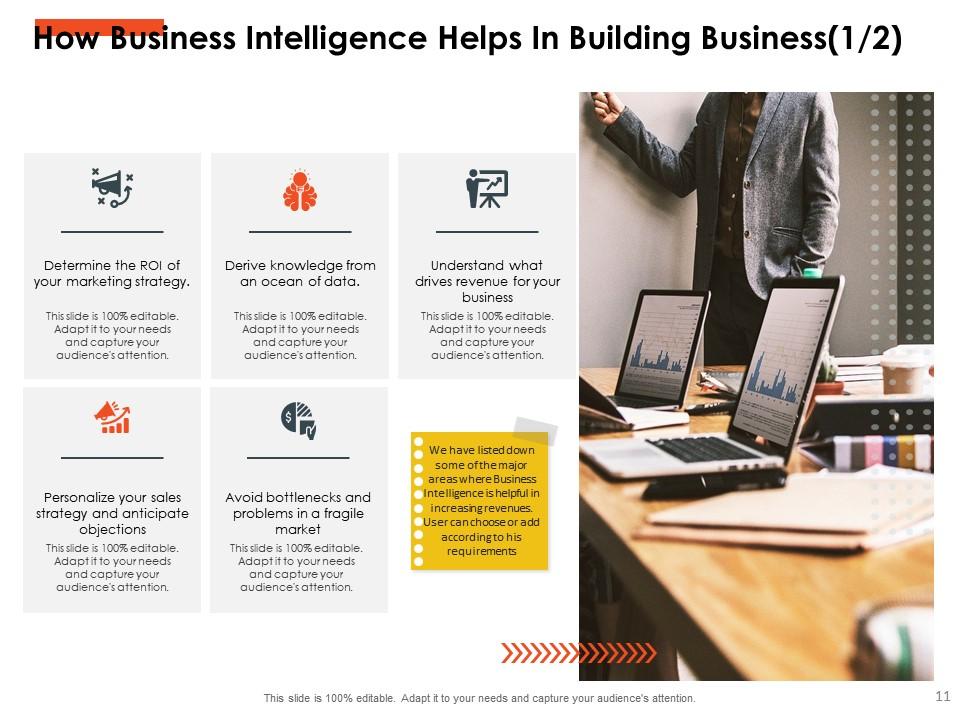
Slide 11: This slide represents How Business Intelligence Helps In Building Business.
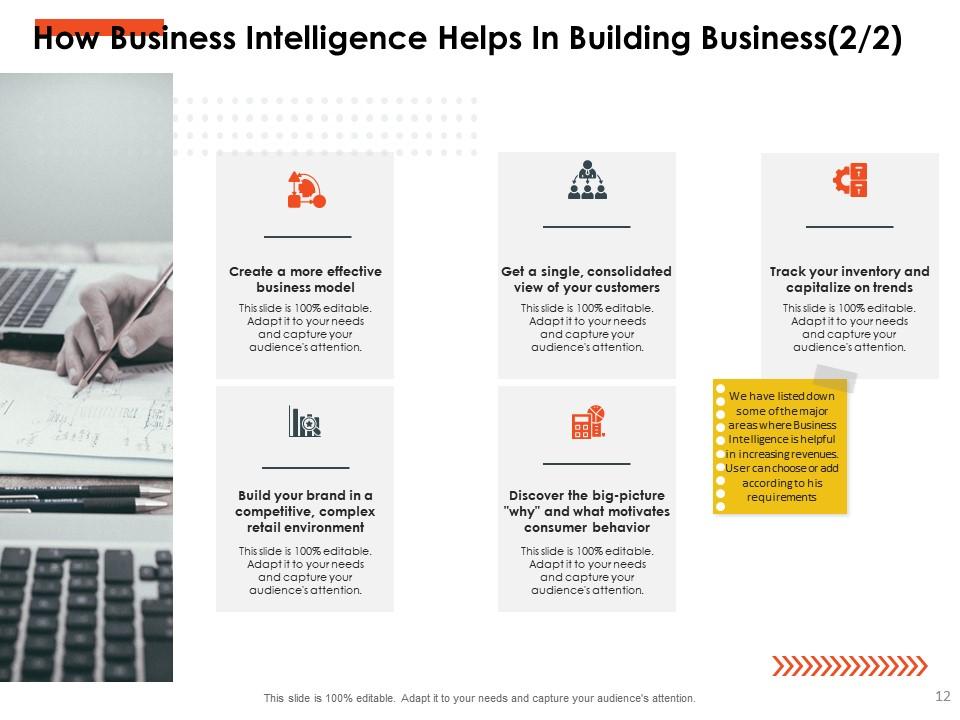
Slide 12: This is another slide showcasing How Business Intelligence Helps In Building Business.
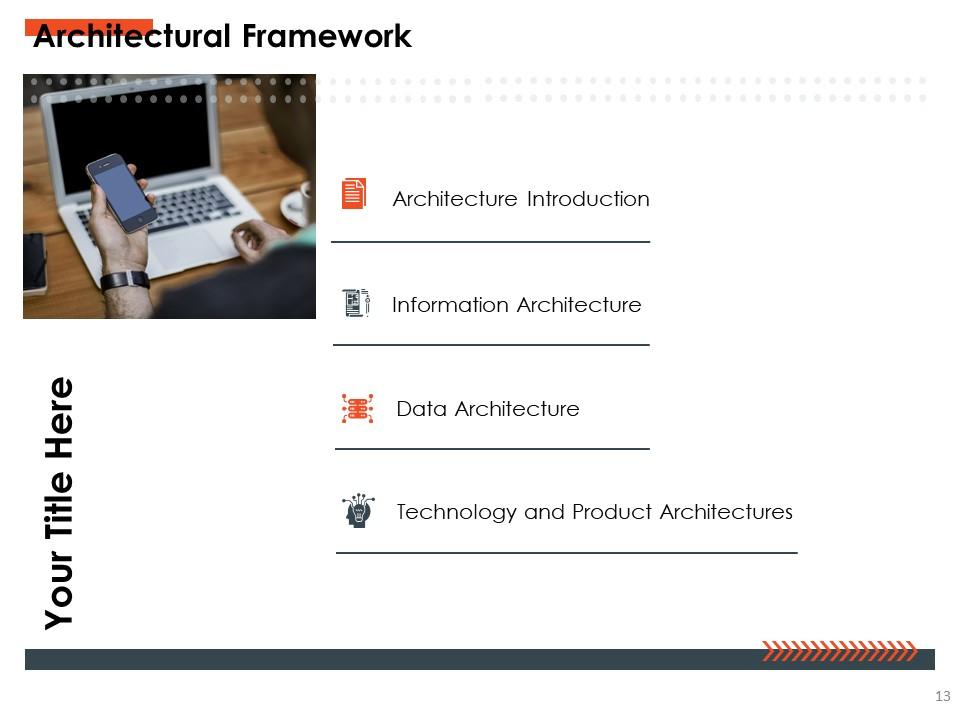
Slide 13: This slide shows Architectural Framework describing- Architecture Introduction, Technology and Product Architectures, Data Architecture, etc.
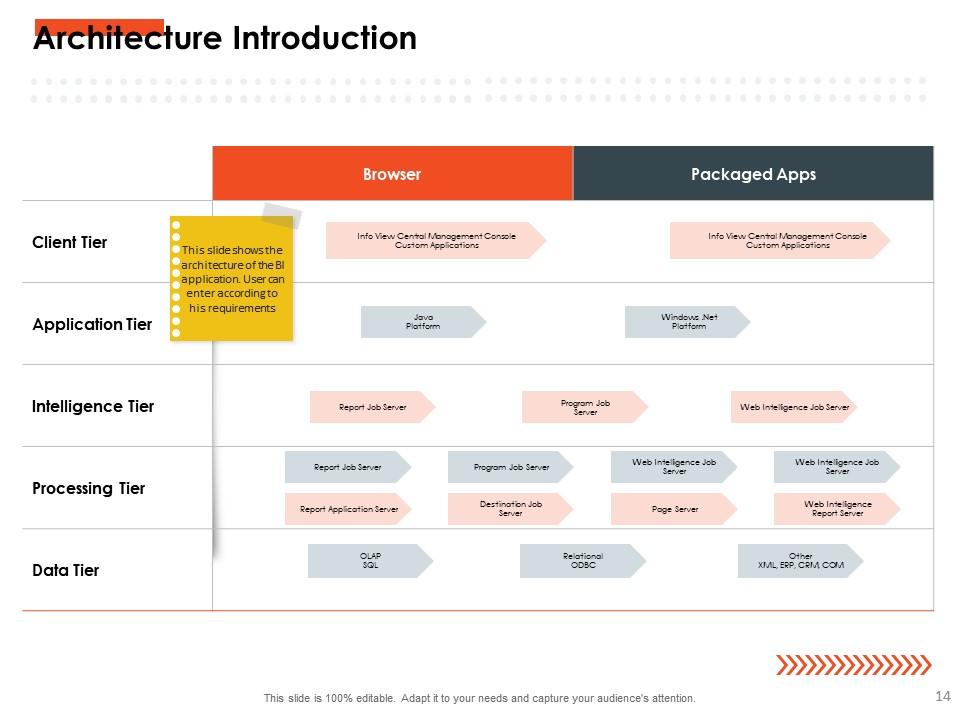
Slide 14: This slide presents Architecture Introduction describing- Packaged Apps, Client Tier, Intelligence Tier, etc.
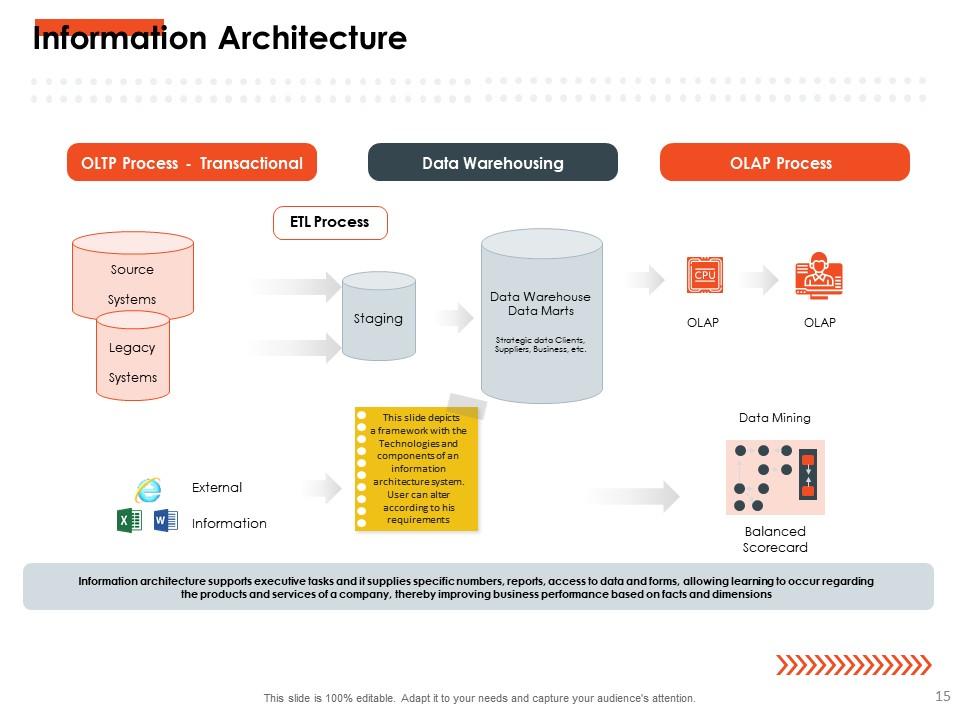
Slide 15: This slide displays Information Architecture describing- OLTP Process - Transactional, Data Warehousing, ETL Process, etc.
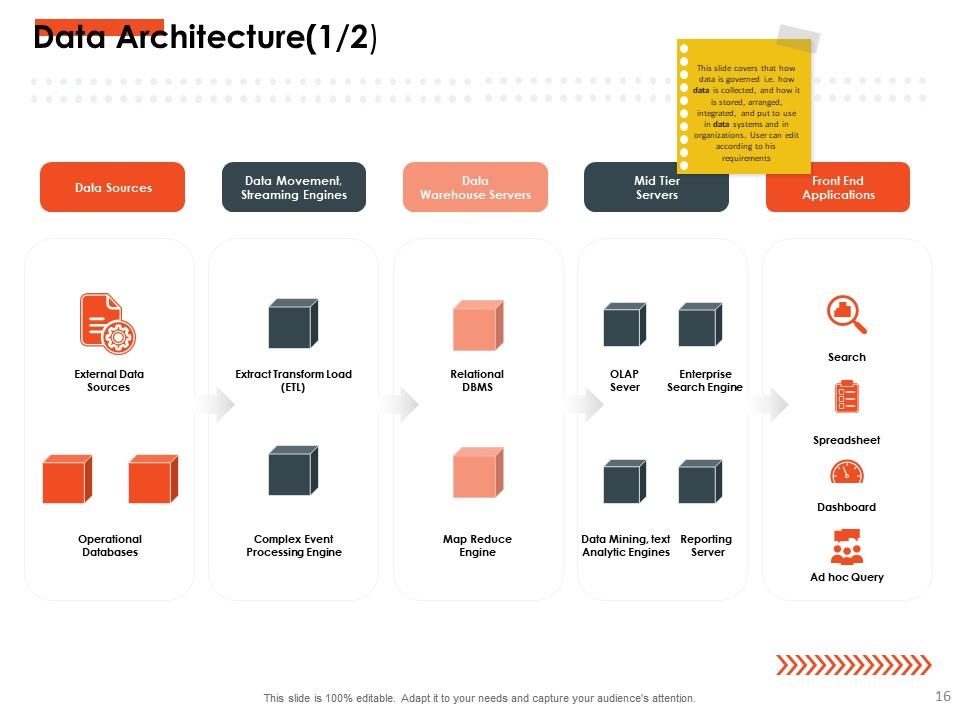
Slide 16: This slide represents Data Architecture describing- Data Movement, Streaming Engines, Data Warehouse Servers, etc.
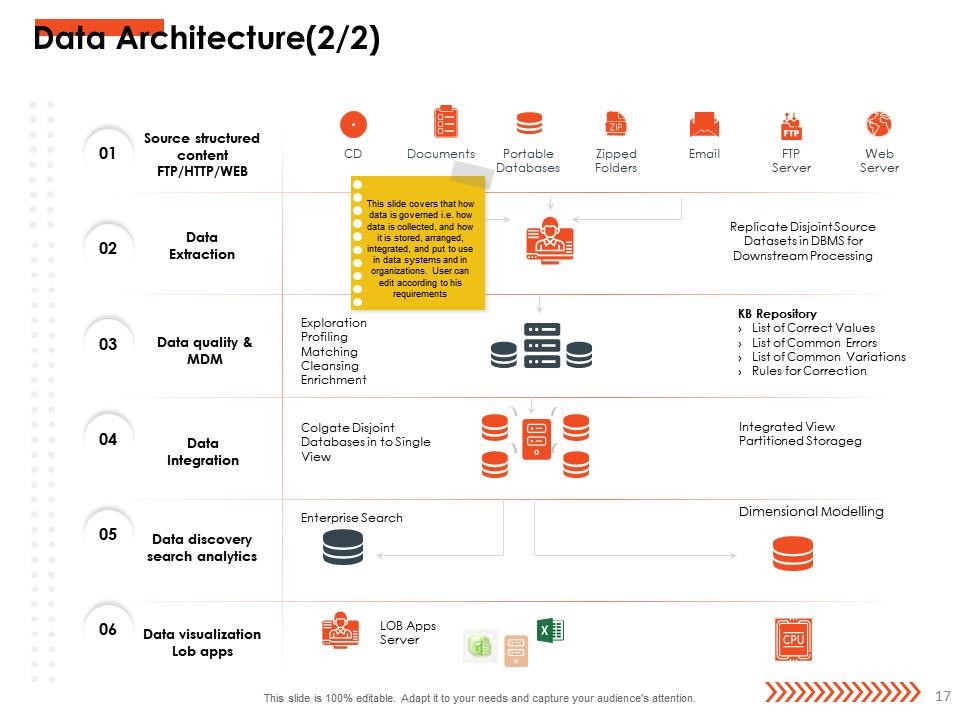
Slide 17: This slide showcases Data Architecture describing- Data Extraction, Data Quality & MDM, Data Integration, etc.
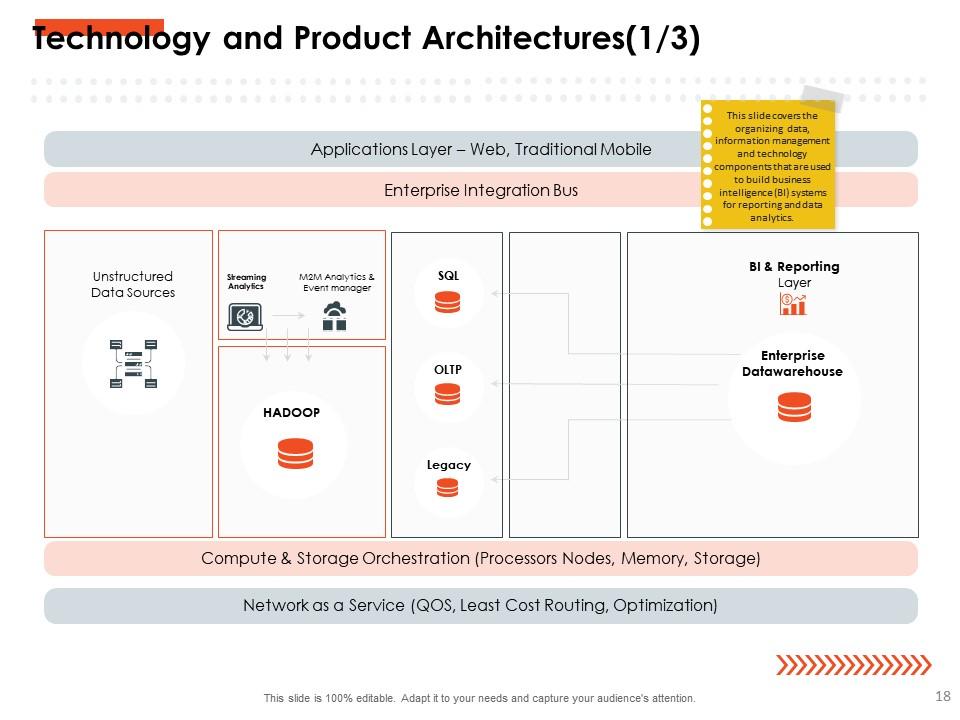
Slide 18: This slide shows Technology and Product Architectures covering the organizing data, information management and technology components.
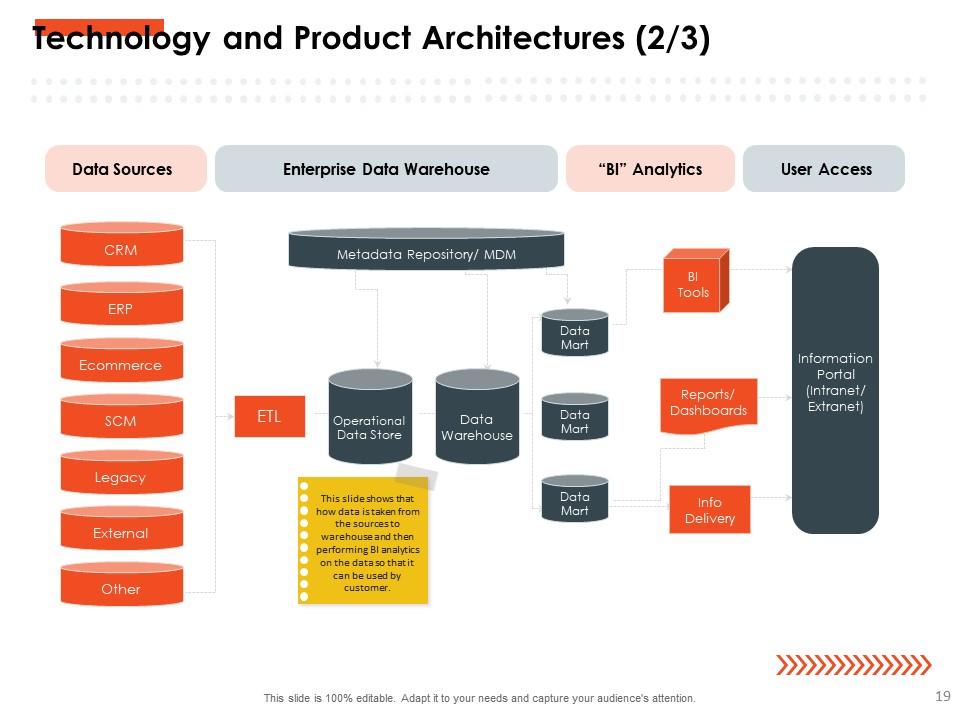
Slide 19: This slide presents Technology and Product Architectures describing- Data Sources, Enterprise Data Warehouse, Operational Data Store, etc.
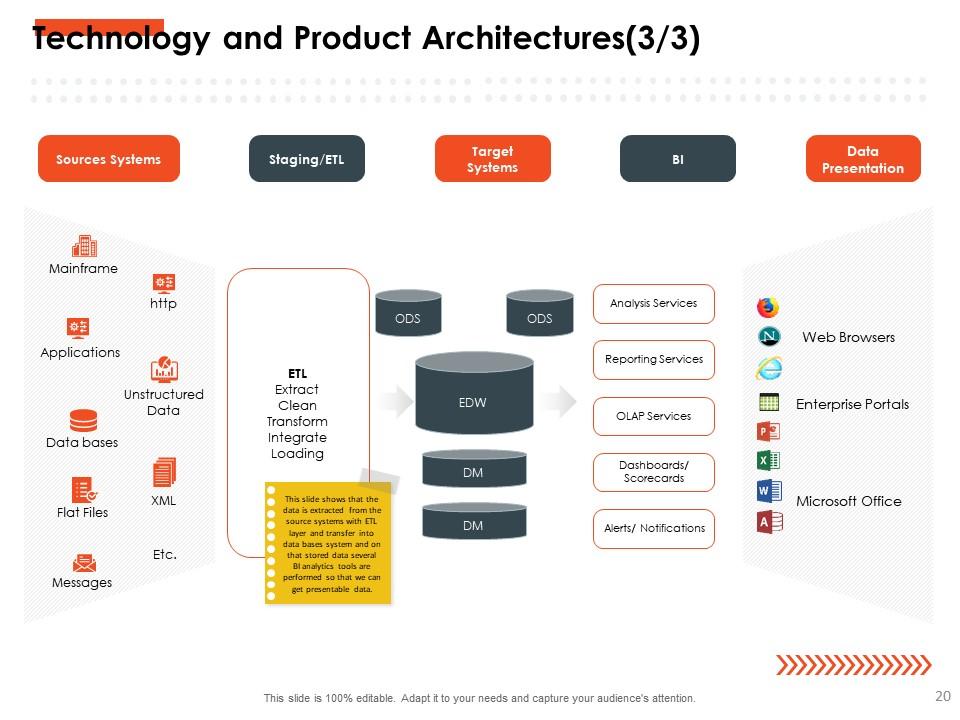
Slide 20: This slide displays Technology and Product Architectures describing- Sources Systems Staging / ETL, Target Systems, etc.
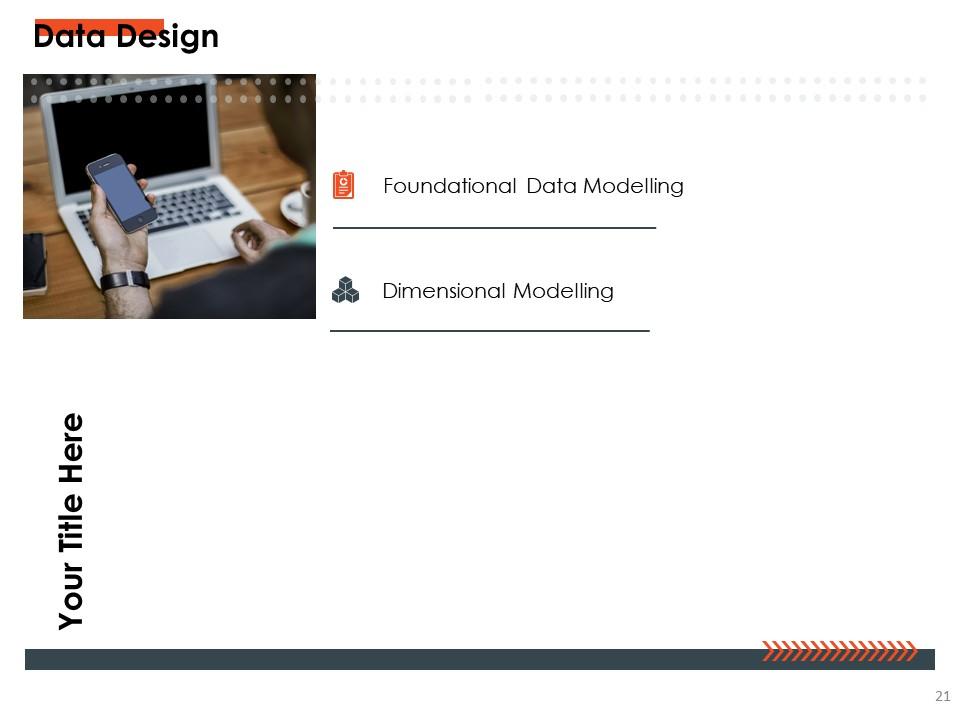
Slide 21: This slide represents Data Design describing- Foundational Data Modelling, Dimensional Modelling, etc.
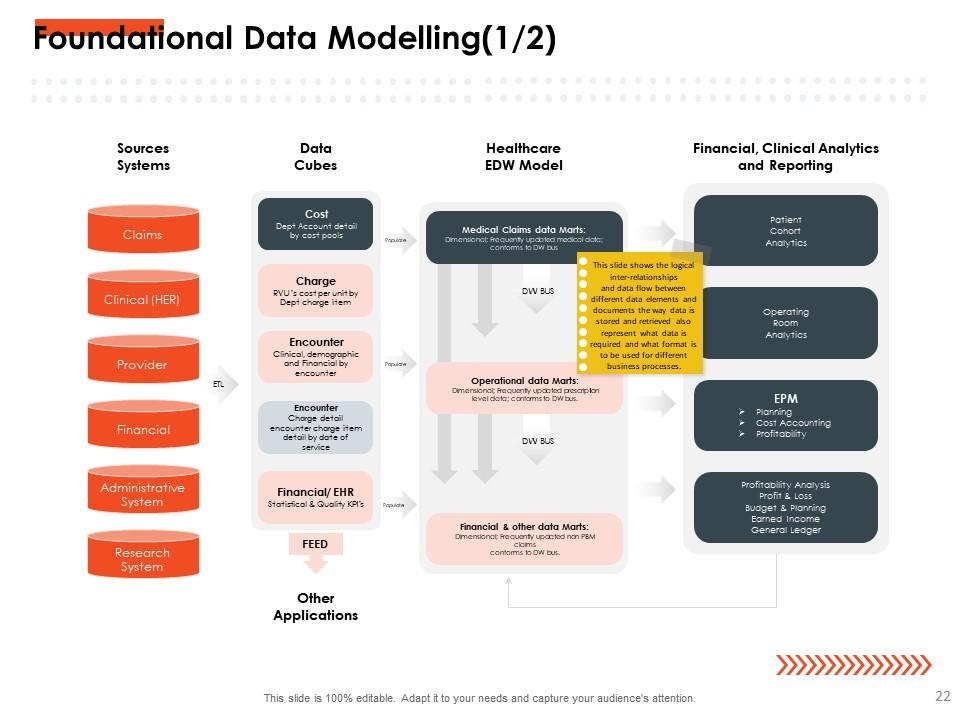
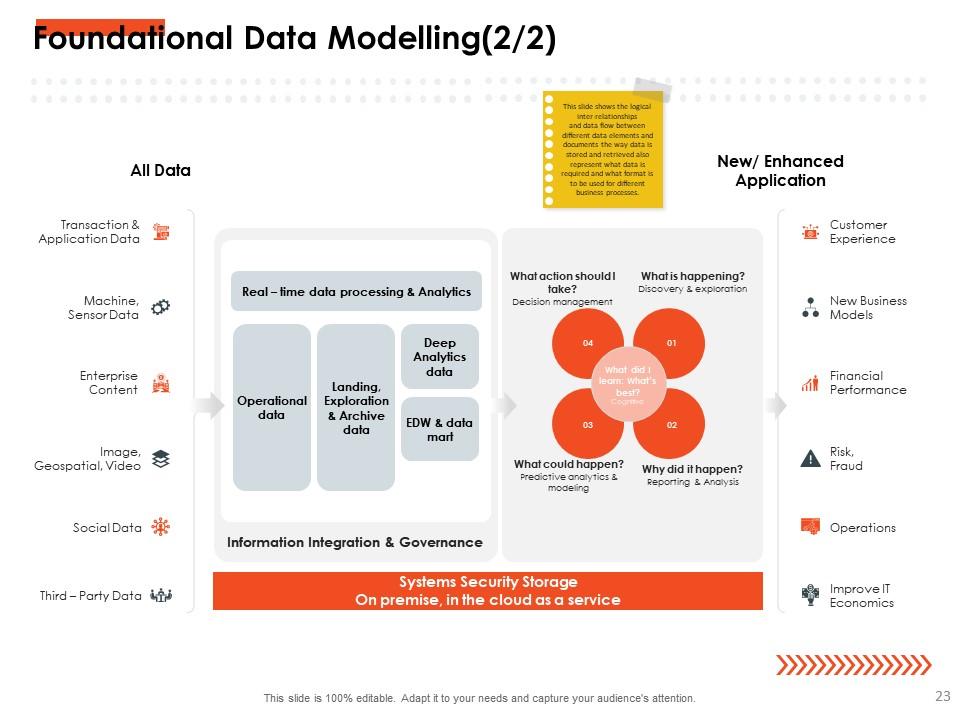
Slide 22: This slide showcases Foundational Data Modelling describing the logical inter-relationships and data flow between different data elements.
Slide 23: This slide shows Foundational Data Modelling describing- Systems Security Storage, Customer Experience, Financial Performance, etc.
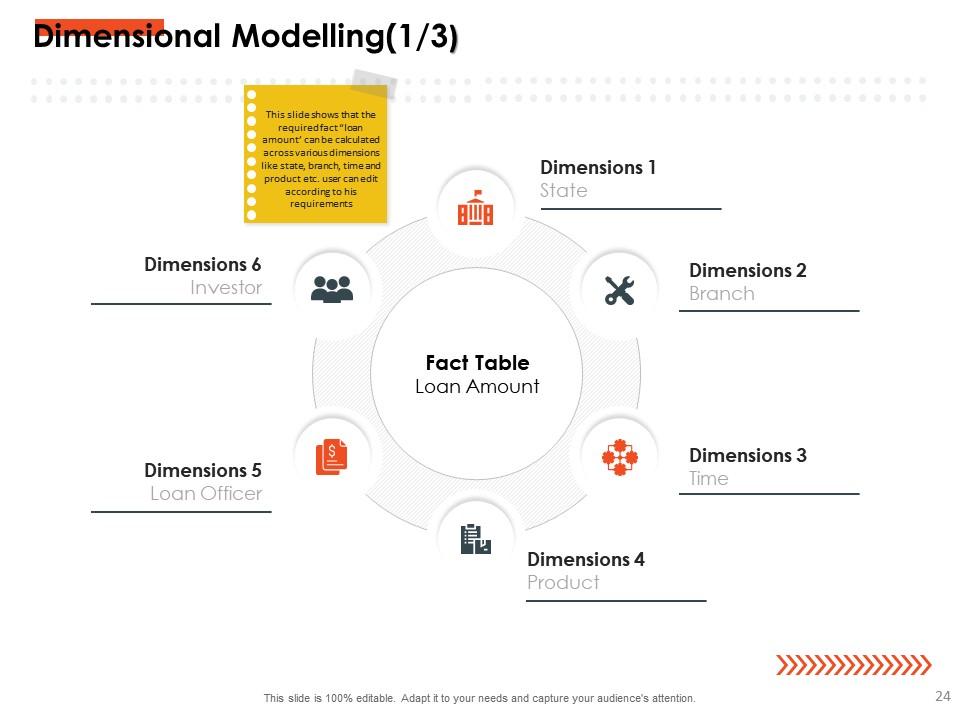
Slide 24: This slide presents Dimensional Modelling describing various dimensions like- State, Product, Branch, etc.
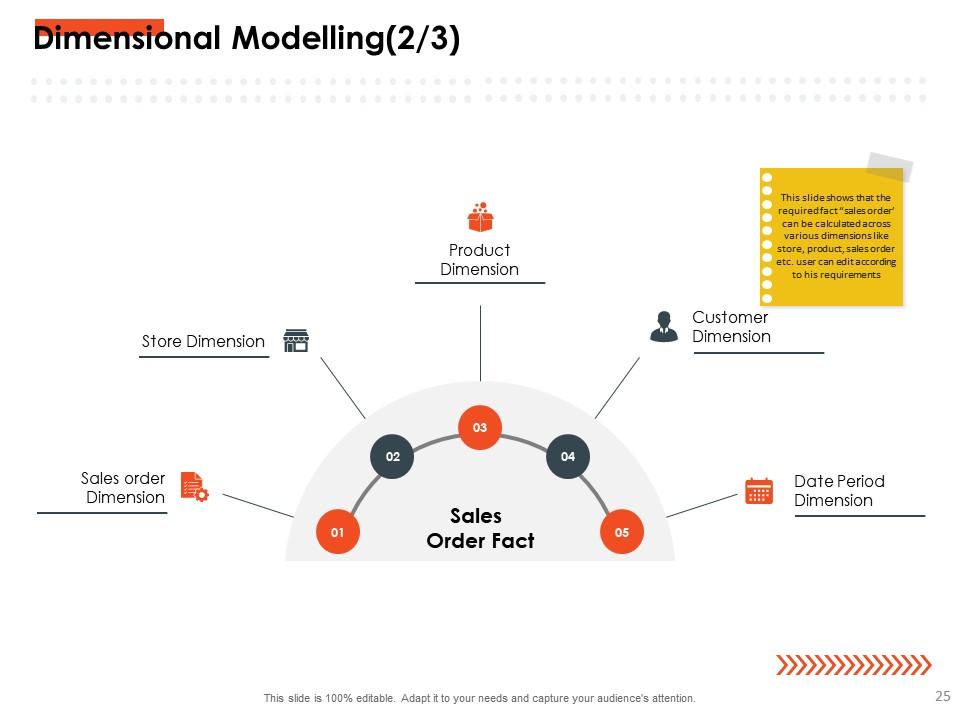
Slide 25: This is another slide displaying Dimensional Modelling describing- Product Dimension, Sales order Dimension, Date Period Dimension, etc.
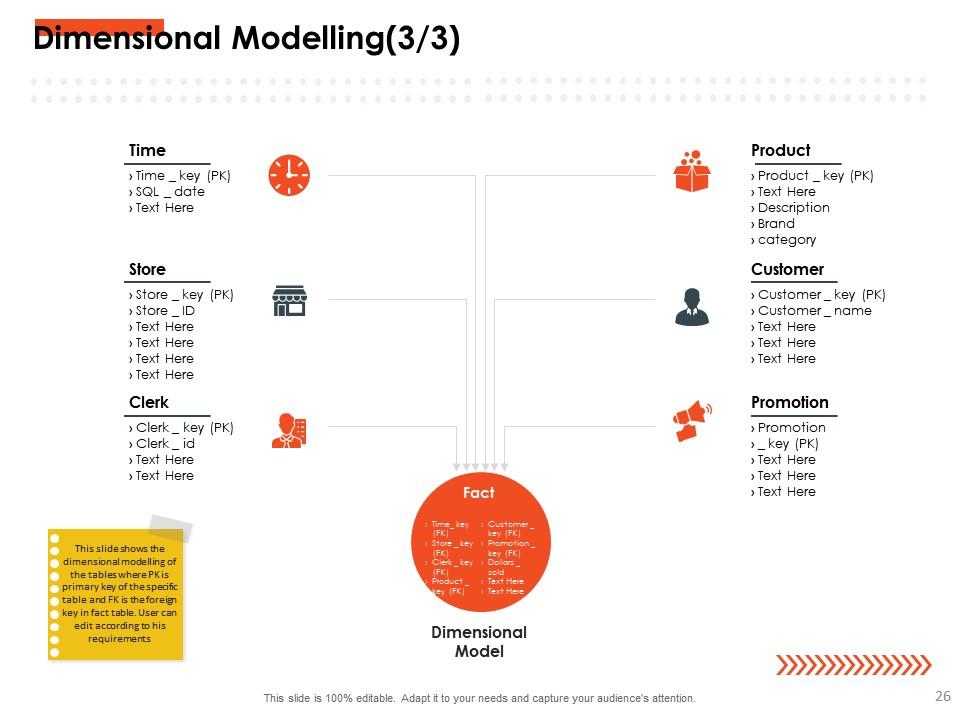
Slide 26: This slide shows Dimensional Modelling describing- Product, Customer, Promotion, Time, etc.
Slide 27: This slide presents Data Integration Design describing- Data Integration Model, Data Integration Processes, etc.
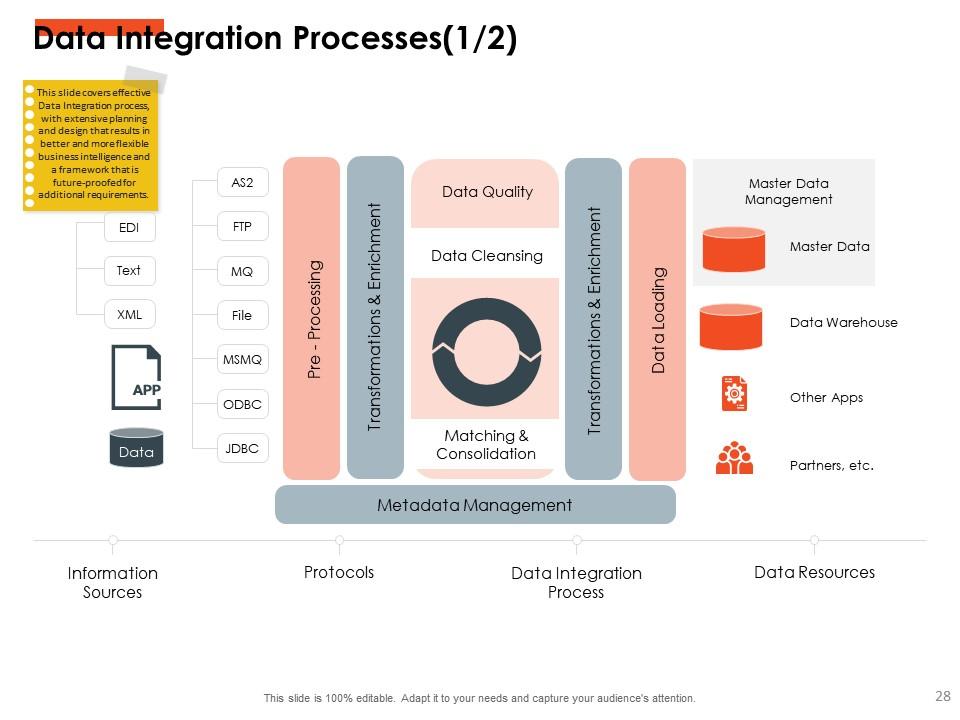
Slide 28: This slide displays Data Integration Processes describing- Master Data Management, Data Warehouse, Data Integration Process, etc.
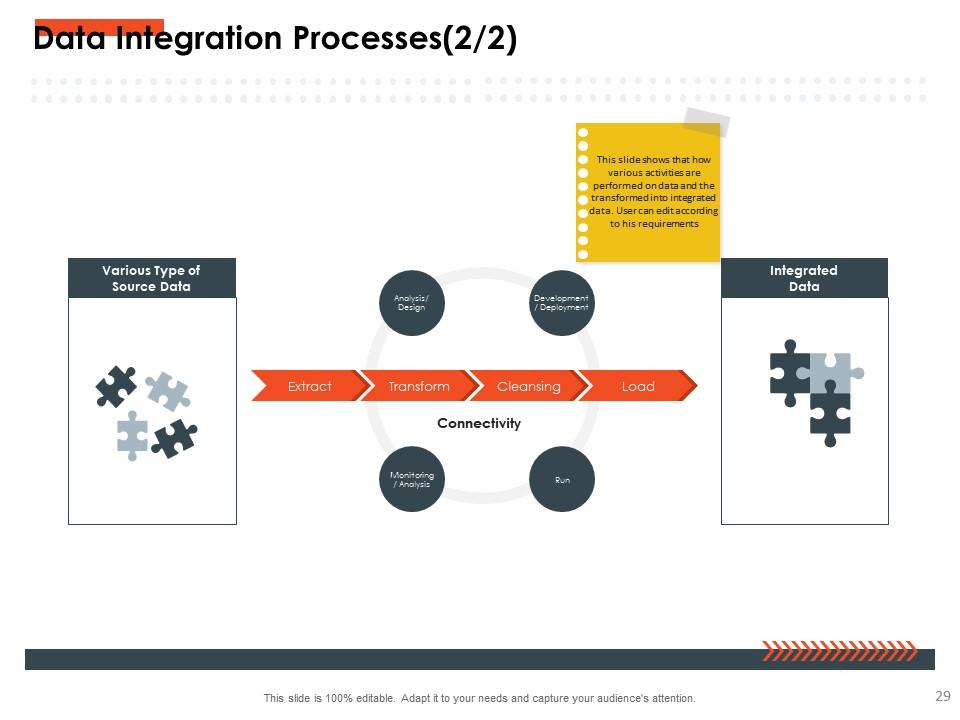
Slide 29: This is another slide showing Data Integration Processes describing- Extract, Transform, Cleansing, etc.
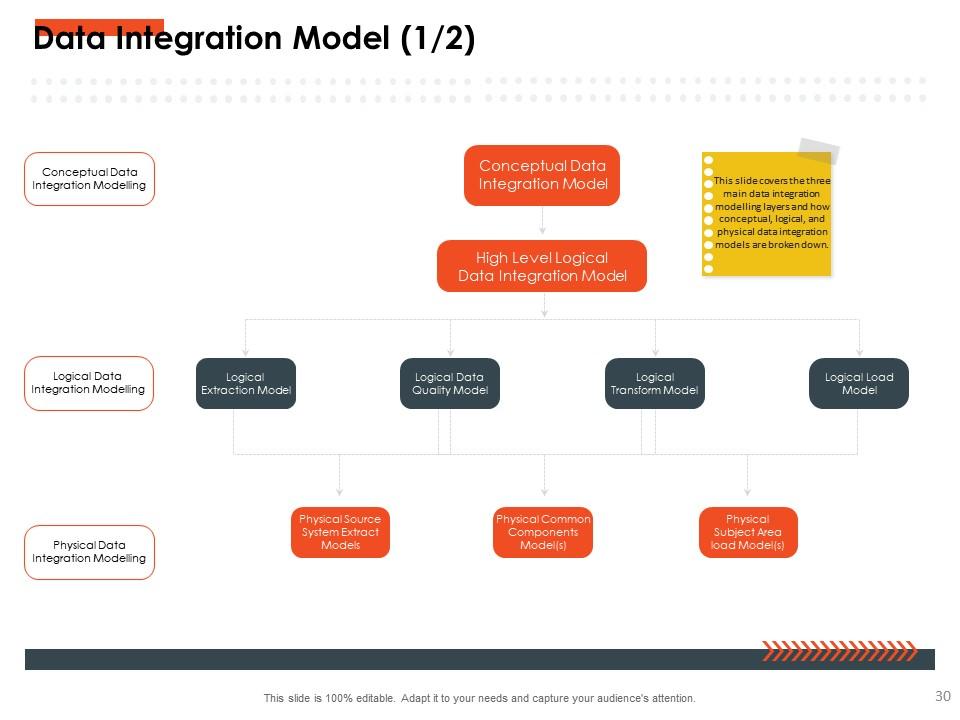
Slide 30: This slide shows Data Integration Model describing- Physical Source System Extract Models, Physical Common Components Models, Physical Subject Area load Models, etc.
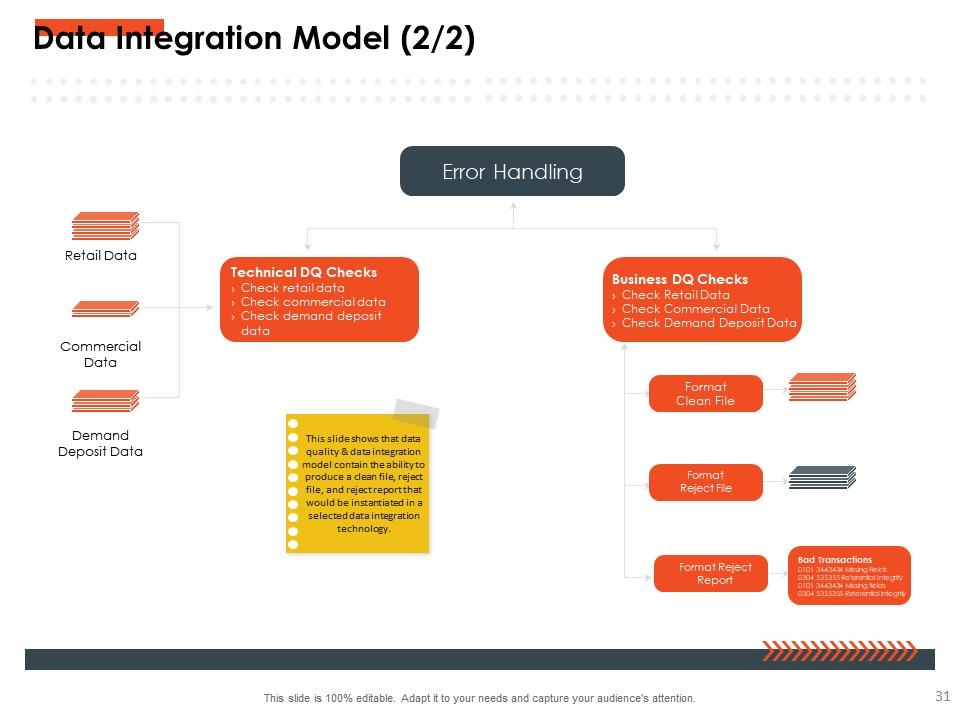
Slide 31: This slide presents Data Integration Model describing- Retail Data, Commercial Data, Demand Deposit Data, etc.
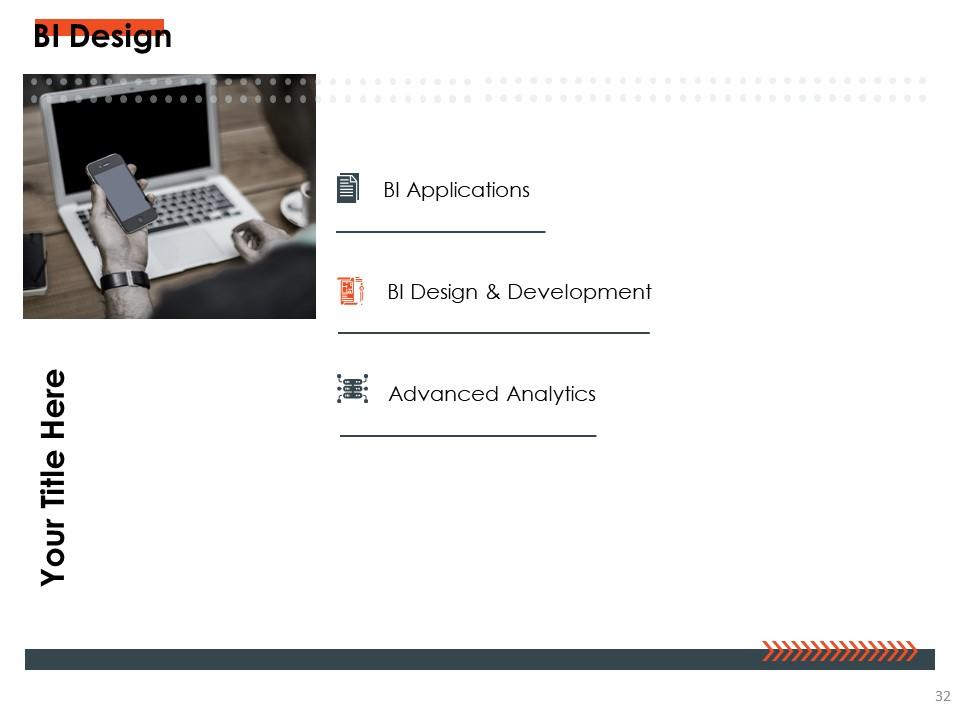
Slide 32: This slide displays BI Design describing- Advanced Analytics, BI Design & Development, BI Applications, etc.
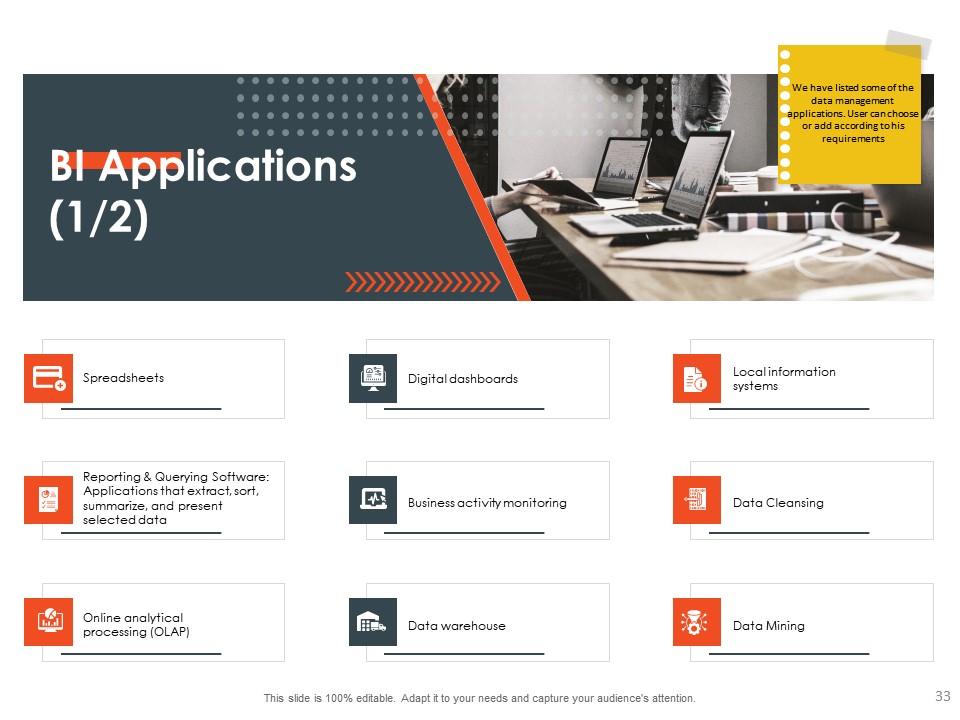
Slide 33: This slide represents BI Applications describing- Spreadsheets, Reporting & Querying Software, Digital dashboards, etc.
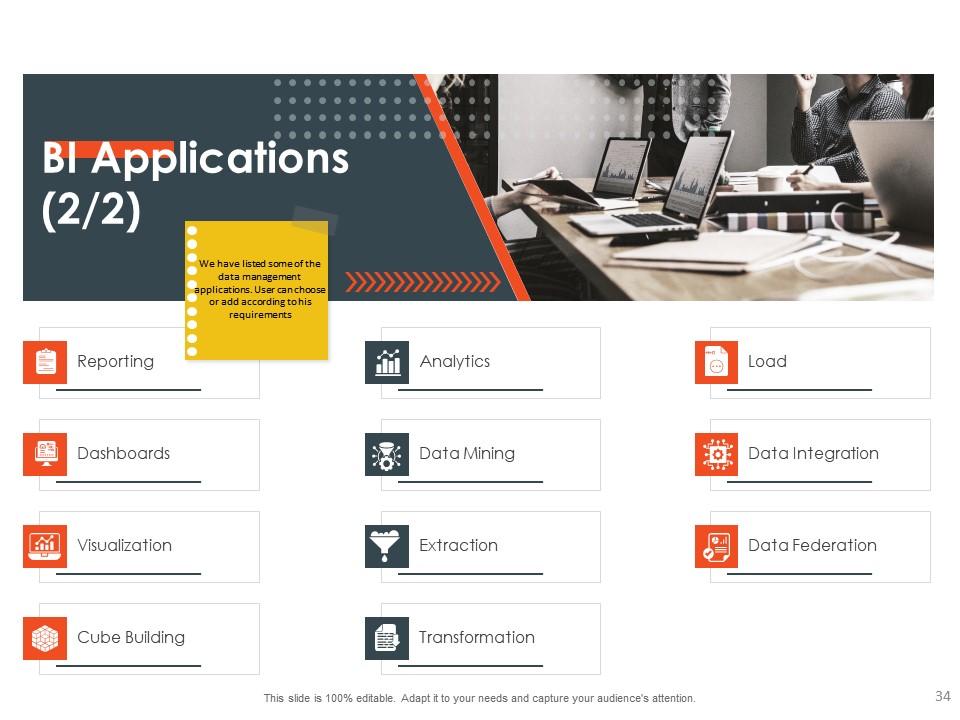
Slide 34: This is another slide showcasing BI Applications describing- Visualization, Analytics, Extraction, etc.
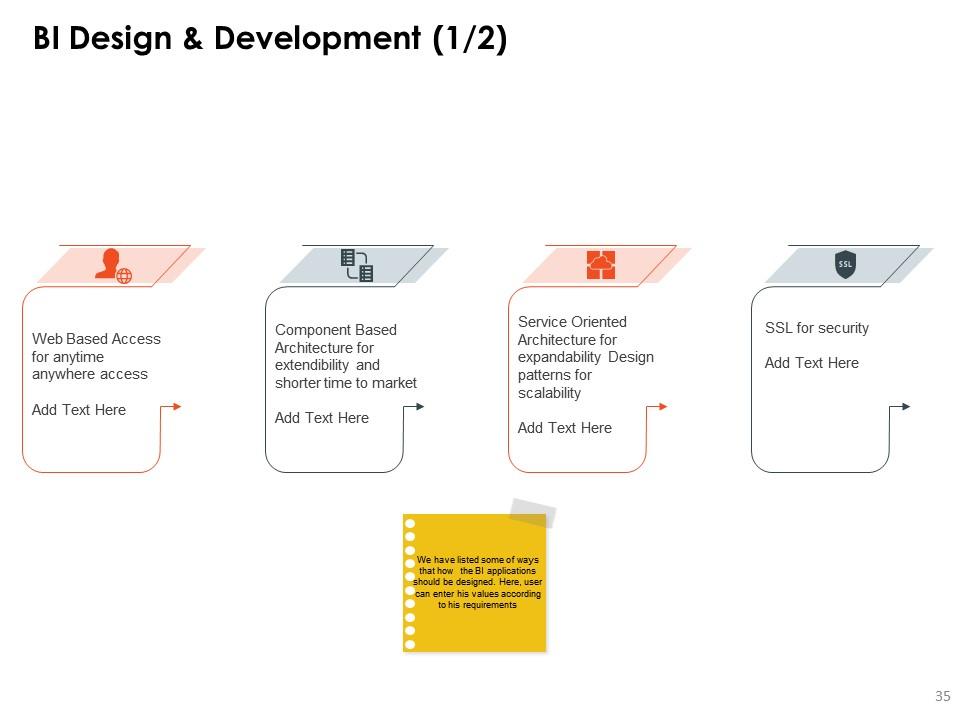
Slide 35: This slide shows BI Design & Development with related imagery and text.
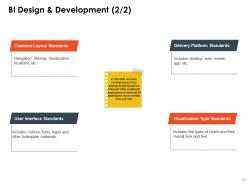
Slide 36: This slide presents BI Design & Development describing- User Interface Standards, Common Layout Standards, Visualization Type Standards, etc.
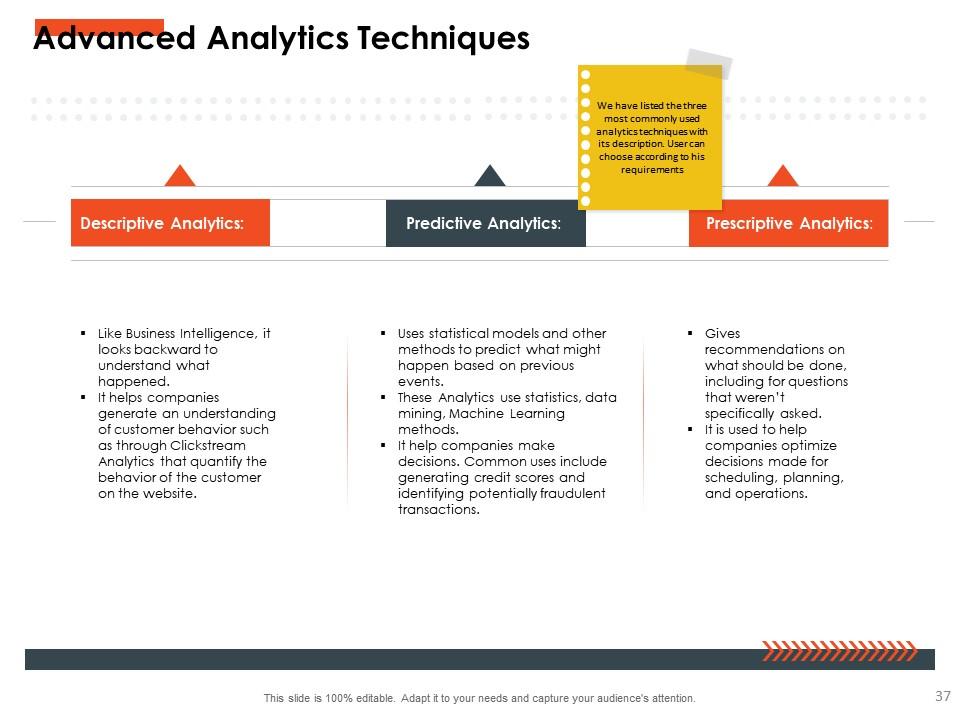
Slide 37: This slide displays Advanced Analytics Techniques describing- Prescriptive Analytics, Descriptive Analytics, Predictive Analytics, etc.
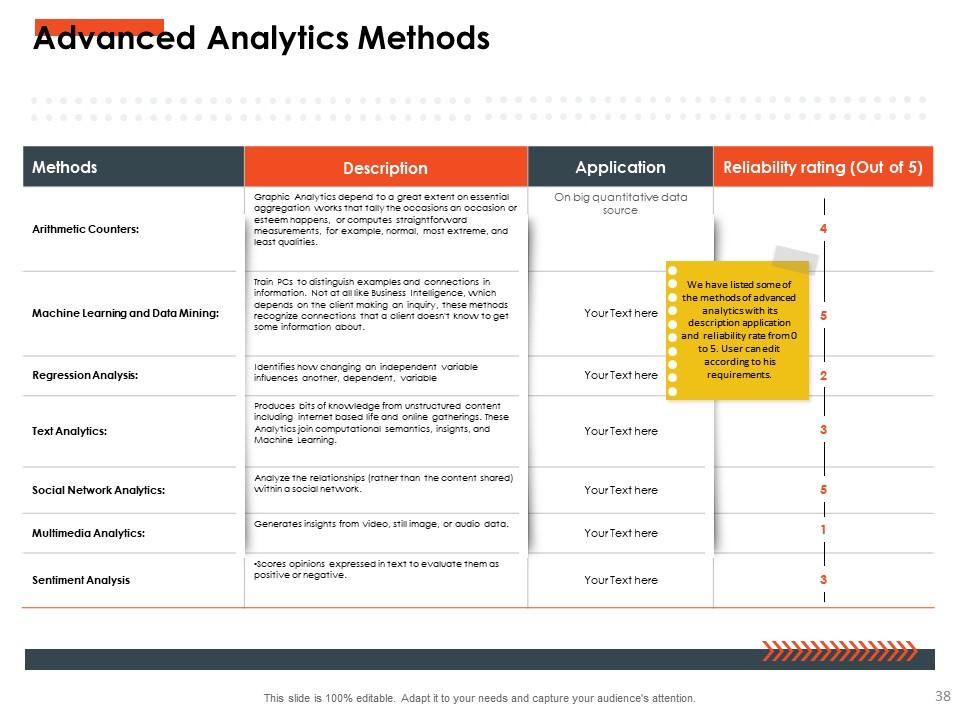
Slide 38: This slide represents Advanced Analytics Methods with its description application and reliability rate.
Slide 39: This slide showcases Advanced Analytics Final Output Results with related imagery.
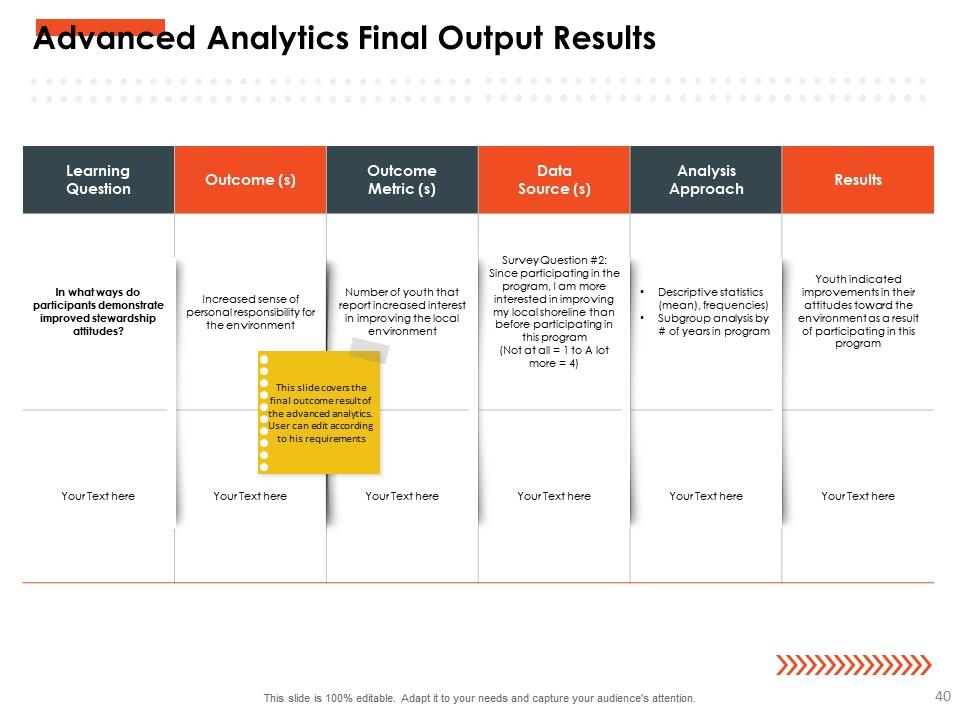
Slide 40: This slide shows Advanced Analytics Final Output Results.
Slide 41: This slide presents Business Intelligence KPIS & Dashboard with related icons.
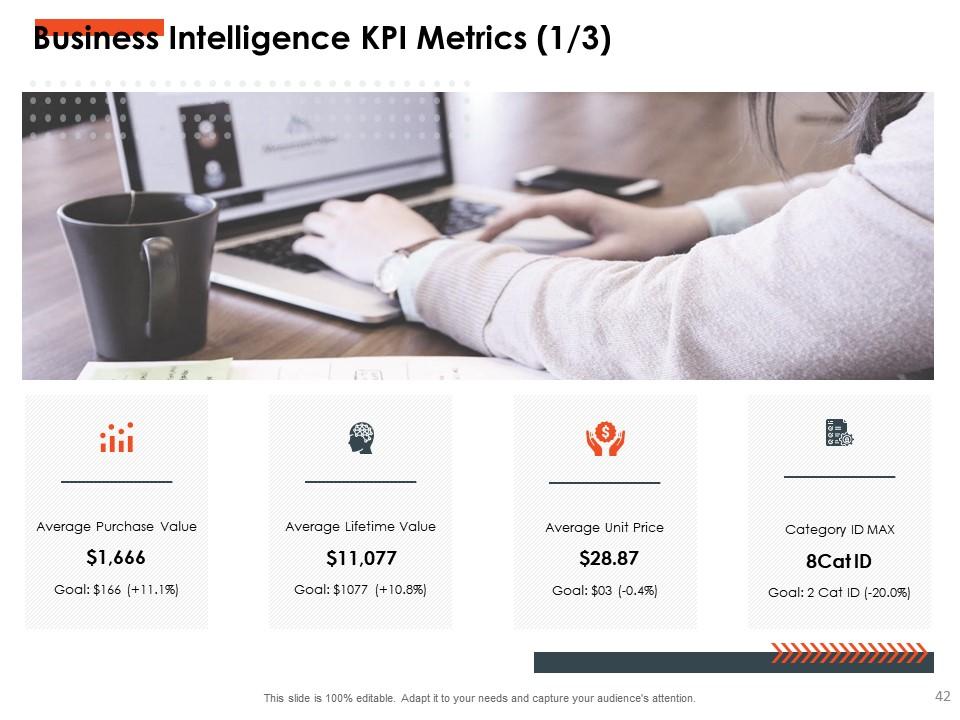
Slide 42: This slide displays Business Intelligence KPI Metrics describing- Average Unit Price, Average Purchase Value, Average Lifetime Value, etc.
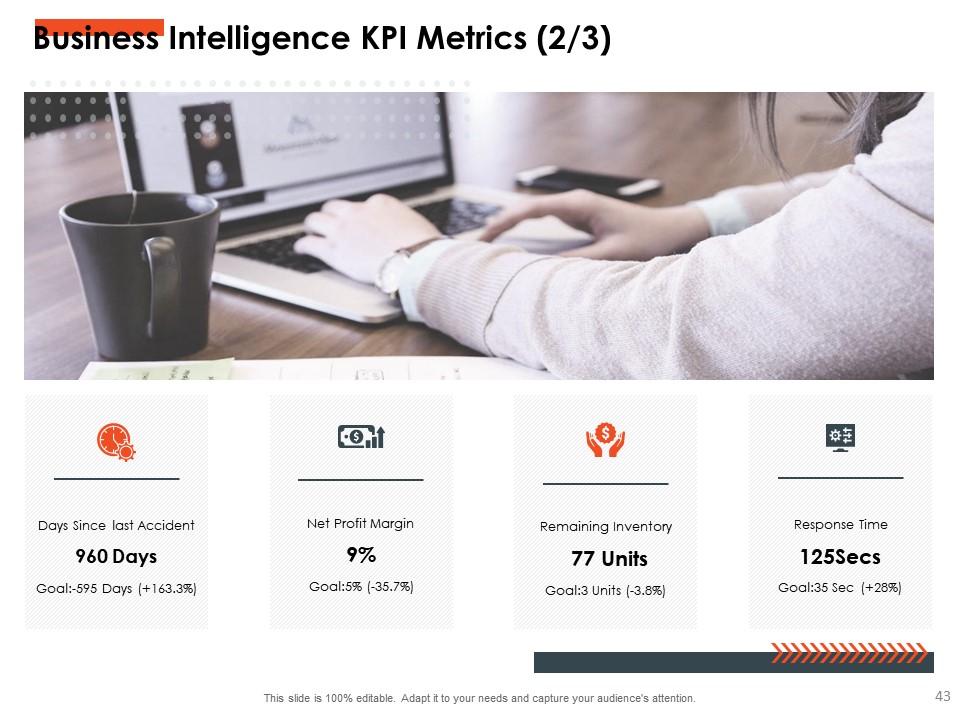
Slide 43: This slide represents Business Intelligence KPI Metrics describing- Days Since last Accident, Net Profit Margin, Remaining Inventory, etc.
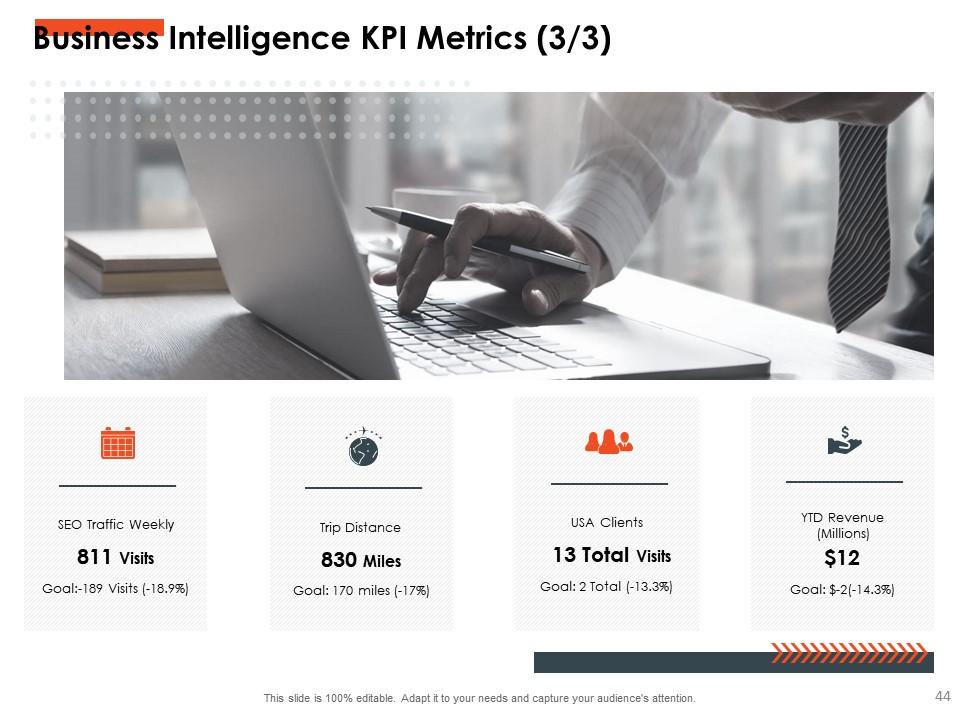
Slide 44: This is another slide showing Business Intelligence KPI Metrics describing- SEO Traffic Weekly, Trip Distance, USA Clients, etc.
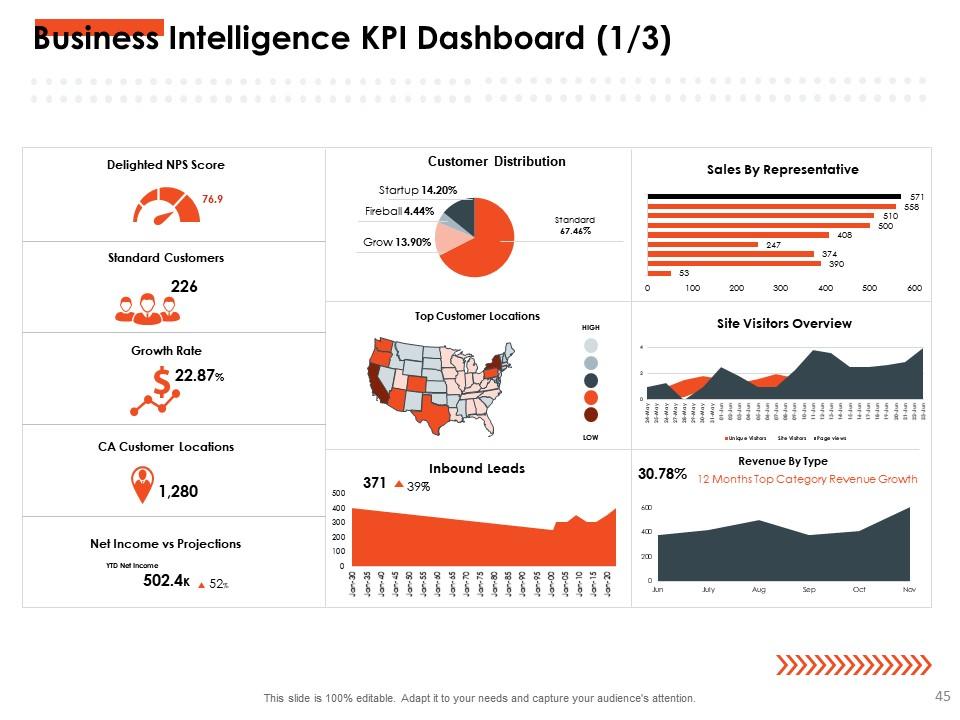
Slide 45: This slide presents Business Intelligence KPI Dashboard describing- Growth Rate, CA Customer Locations, Net Income vs Projections, etc.
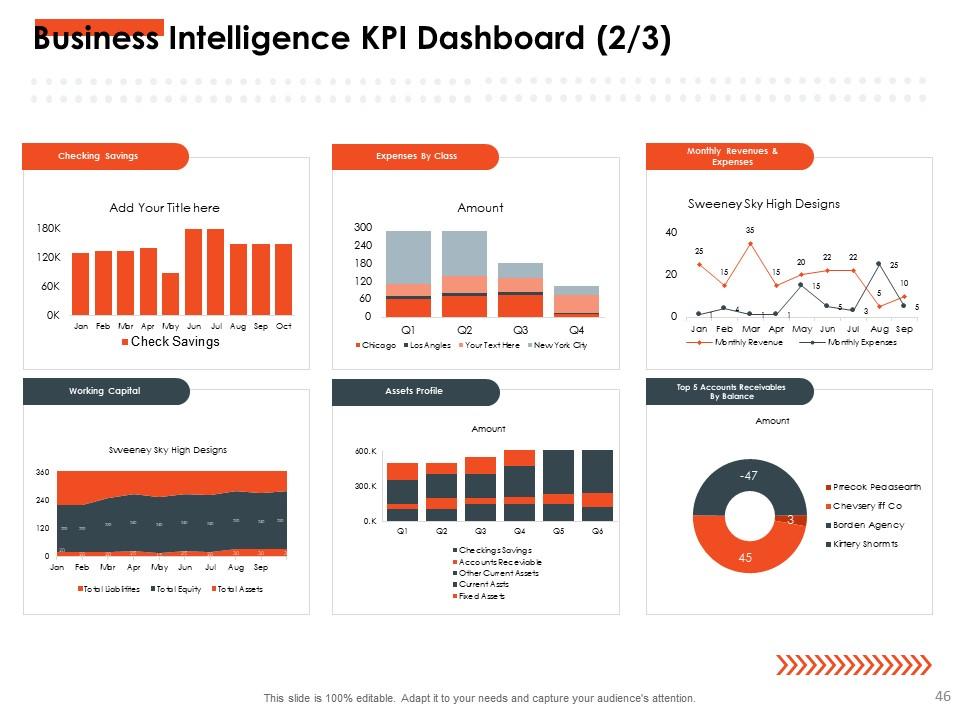
Slide 46: This slide displays Business Intelligence KPI Dashboard describing- Top 5 Accounts Receivables By Balance, Checkings Savings, Expenses By Class, etc.
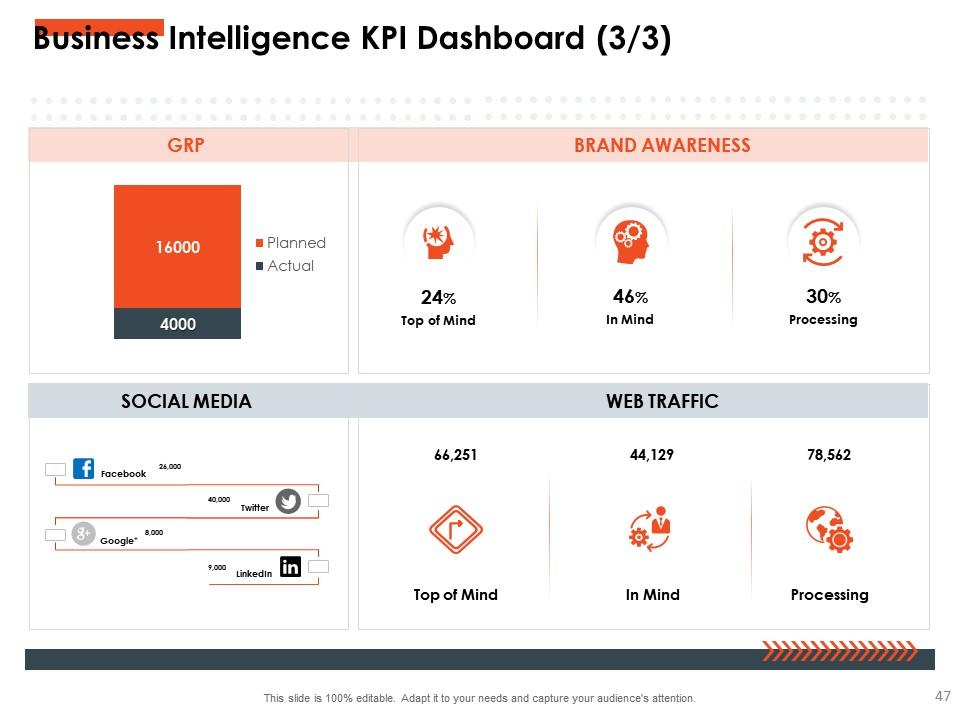
Slide 47: This slide shows Business Intelligence KPI Dashboard describing- Brand awareness, Social media, Web traffic, etc.
Slide 48: This slide displays Operational Intelligence Icons.
Slide 49: This slide is titled as Additional Slides for moving forward.
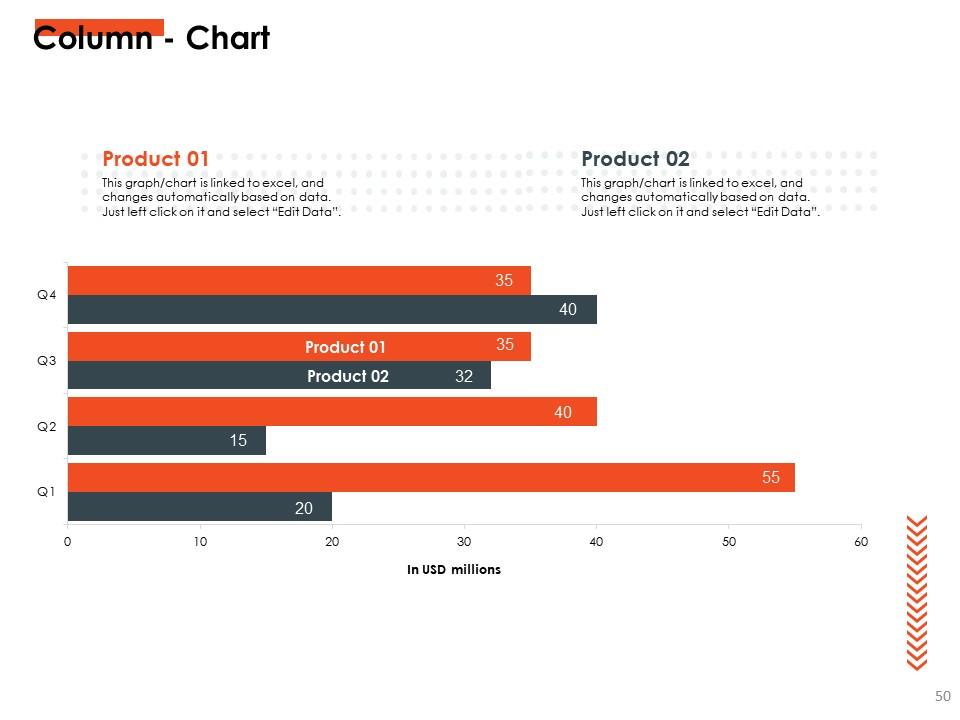
Slide 50: This slide shows Column - Chart with two products comparison.
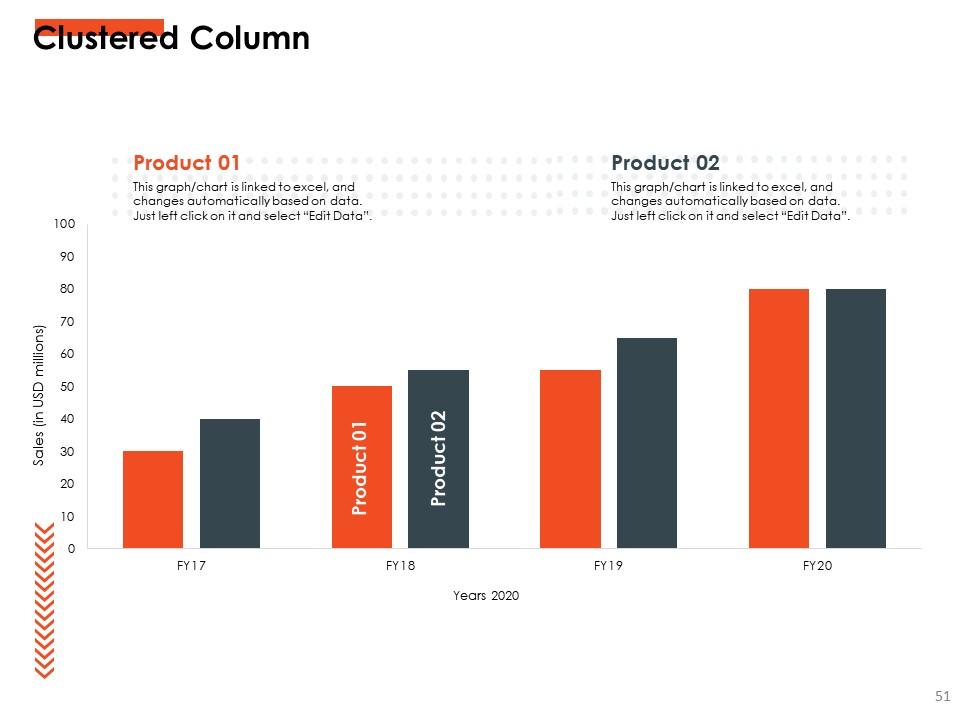
Slide 51: This slide presents Clustered Column chart with two products comparison.
Slide 52: This is a Timeline slide. Show time intervals related data here.
Slide 53: This slide shows Post It Notes. Post your important notes here.
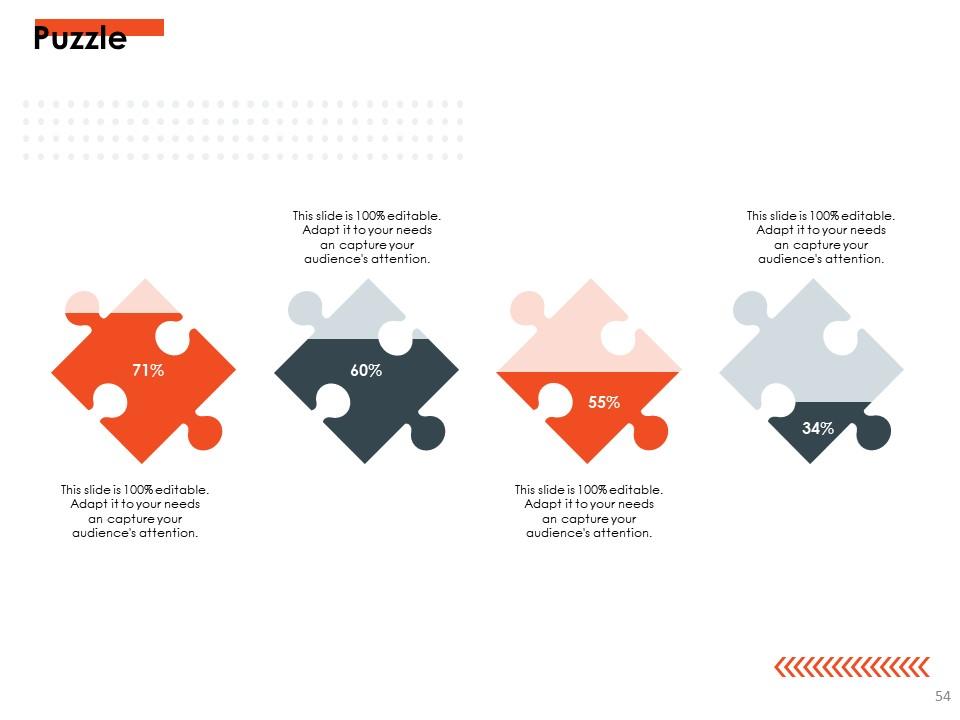
Slide 54: This is a Puzzle slide with additional text boxes.
Slide 55: This slide shows Magnifying Glass. Use it to highlight information.
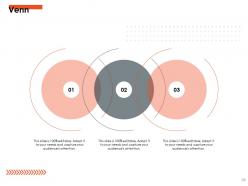
Slide 56: This slide shows Venn diagram with additional text boxes.
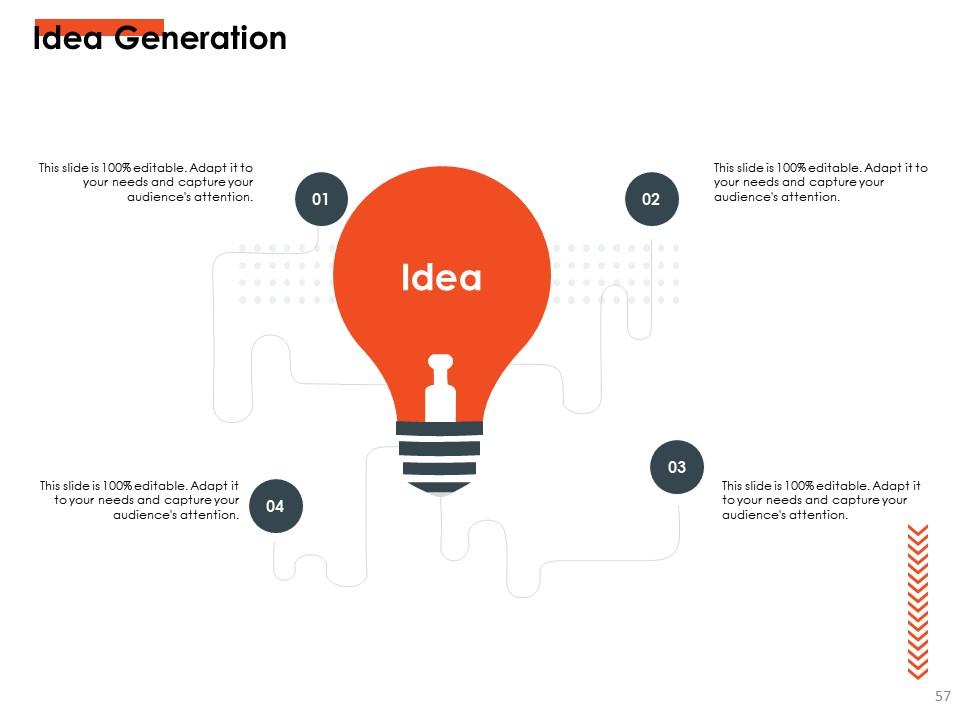
Slide 57: This is an Idea Generation slide to state a new idea or highlight information, specifications, etc.
Slide 58: This is a Thank You slide with address, contact number and email address.
Operational intelligence powerpoint presentation slides with all 58 slides:
Use our Operational Intelligence Powerpoint Presentation Slides to effectively help you save your valuable time. They are readymade to fit into any presentation structure.
-
Content of slide is easy to understand and edit.
-
Excellent work done on template design and graphics.
-
Informative design.
-
Great product with effective design. Helped a lot in our corporate presentations. Easy to edit and stunning visuals.


