

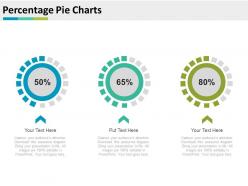
Percentage Pie Charts For Merger And Acquisitions Powerpoint Slides





Try Before you Buy Download Free Sample Product
 Impress Your
Audience
 100%
Editable
 Save Hours
of Time


Not certain from where to begin a business merger and acquisitions PowerPoint presentation? Our readymade organization merger and acquisitions PPT template can help you here! With our merger and acquisitions PowerPoint thoughts you will access unending unique and interesting slide formats. You can fuse our presentation topics of merger and acquisitions as haggling or arrangement analogy to successfully set the tone of meeting and thus can pick up edge in transactions. Going further, our business officials can apply these pictures to typically speak to upbeat arrangement or agreements effectively finished with organizations. Best part here is that our merger and acquisitions PowerPoint outlines is that it well cater the corporate introduction needs of wide experts. Snappy and straightforward customization of our pre made merger and acquisitions PowerPoint subjects is another component that makes our gathering a lucky one. By downloading our percentage pie charts for merger and acquisitions bargains PowerPoint template slide designs are a piece of effective expert's tip top club. Our Percentage Pie Charts For Merger And Acquisitions Powerpoint Slides are classic yet contemporary. A beautiful blend of the best of all ages.
People who downloaded this PowerPoint presentation also viewed the following :
Percentage Pie Charts For Merger And Acquisitions Powerpoint Slides with all 4 slides:
Be able to discern what the future contains with our Percentage Pie Charts For Merger And Acquisitions Powerpoint Slides. They allow you to see through the haze.


FAQs for Percentage Pie Charts For Merger And
Percentage pie charts offer immediate visual comprehension of proportional relationships, clear part-to-whole comparisons, intuitive data interpretation, and effective communication of market share distributions. These visualizations streamline complex data presentation by enabling stakeholders to quickly identify dominant segments, assess resource allocation efficiency, and communicate findings to diverse audiences, ultimately delivering enhanced decision-making capabilities across organizations.
Percentage pie charts enhance understanding by instantly visualizing how individual parts relate to the whole, making complex proportional relationships immediately comprehensible through intuitive visual segments. These charts streamline data interpretation for stakeholders by eliminating mental calculations, enabling faster decision-making in financial reporting, market analysis, and resource allocation presentations, ultimately delivering clearer insights and more effective business communications.
Percentage pie charts excel when displaying parts of a whole relationship where proportional visualization matters more than precise value comparison, particularly for budget allocations, market share analysis, and demographic breakdowns. Unlike bar graphs that emphasize individual comparisons or line charts that track trends, pie charts enable audiences to immediately grasp relative proportions and compositional relationships, with many organizations finding them highly effective for executive presentations and stakeholder communications.
Common mistakes include using too many categories, choosing poor color contrast, omitting data labels, starting segments from incorrect positions, and displaying percentages that don't total 100%. These errors compromise chart readability and data accuracy, with many organizations finding that streamlined designs with 3-5 clear segments, consistent labeling, and logical color schemes ultimately deliver better audience comprehension and more effective data presentations.
Choose colors with sufficient contrast for accessibility, use a logical sequence like complementary or monochromatic schemes, and ensure labels are clear and concise with percentage values prominently displayed. Many organizations find that consistent color coding across similar data categories, combined with direct labeling on larger segments and legends for smaller ones, enhances comprehension and delivers more impactful presentations.
Popular tools for creating percentage pie charts include Microsoft Excel, Google Sheets, Tableau, Power BI, and specialized presentation software like SlideTeam templates. These platforms streamline data visualization by offering intuitive interfaces, customizable design options, and seamless integration capabilities, with many organizations finding that combining robust analytics tools with professional presentation templates ultimately delivers more impactful stakeholder communications and faster decision-making processes.
Percentage pie charts effectively communicate proportional data in business presentations by clearly showing market share distributions, budget allocations, customer demographics, revenue breakdowns, and resource utilization at a glance. These visual tools enable executives to quickly grasp relative proportions and make strategic decisions, with many organizations finding that well-designed pie charts enhance stakeholder understanding and drive faster consensus during critical business discussions.
Scale and proportion are crucial for accurate data interpretation in percentage pie charts, ensuring each slice visually represents its true percentage value without distortion or misleading emphasis. Proper scaling enables viewers to quickly assess data relationships and make informed decisions, with many organizations finding that well-proportioned charts significantly enhance stakeholder comprehension and strategic discussions.
Accuracy in percentage pie charts requires verifying that all segments total exactly 100%, using precise data calculations, and clearly labeling each segment with both percentages and actual values. Double-check source data for errors, round percentages consistently to avoid discrepancies, and ensure visual proportions accurately reflect the numerical values, with many organizations finding that including data tables alongside charts enhances transparency and builds audience trust.
Audience analysis determines whether viewers can quickly interpret pie chart segments and percentages, considering their data literacy levels, cultural background, and decision-making context. For executive presentations requiring rapid insights, pie charts excel at showing market share breakdowns, while technical audiences analyzing complex financial data might need more detailed visualizations for comprehensive analysis.
Creative alternatives to traditional percentage pie charts include donut charts, waffle charts, treemaps, stacked bar charts, and pictorial unit charts. These visualization methods enhance data comprehension by offering clearer proportional relationships, better comparison capabilities, and improved accessibility, with many organizations finding that alternative formats deliver more engaging presentations and reduce misinterpretation of complex percentage data.
Incorporating percentage pie charts into infographics requires strategic placement alongside complementary visuals, clear labeling with percentages and categories, and consistent color schemes that align with your overall design. These charts work particularly well when highlighting market share data, budget allocations, or survey results within broader narratives, with many designers finding that positioning them as focal points while supporting them with contextual text delivers enhanced comprehension and visual impact.
Percentage pie charts struggle with comparing small differences, displaying more than 5-7 categories effectively, and showing data trends over time. Alternative chart types like bar charts, line graphs, or stacked columns deliver clearer comparisons and trend analysis, with many organizations finding that these formats enhance decision-making accuracy and stakeholder comprehension.
Interactive percentage pie charts enhance user engagement by enabling hover effects, clickable segments, drill-down capabilities, and real-time data filtering that transform passive viewing into active exploration. These dynamic features allow presenters to reveal layered insights while audiences interact directly with data, ultimately delivering more memorable presentations and deeper comprehension, with many organizations finding that interactive elements significantly increase audience retention and participation rates.
Accessible percentage pie charts require alternative text descriptions with exact percentages, high contrast color schemes with distinct patterns or textures, and complementary data tables listing all values. Screen reader compatibility becomes essential through proper HTML markup and ARIA labels, while providing multiple format options like bar charts or textual summaries ensures comprehensive accessibility, ultimately delivering inclusive data experiences that reach all audience members effectively.
-
Easily Understandable slides.
-
Enough space for editing and adding your own content.