Performance Management In Energy Sector Powerpoint Presentation Slides
Evaluate the performance of the power industry by using our Performance Management In Energy Sector PowerPoint Presentation Slides. This content ready professionally designed performance evaluation in the energy sector PowerPoint complete deck comprises 29 templates and covers the various topics like gathering and track data, energy conservations project tracking, establish baselines, benchmarking, etc. You can use this assessing performance in the energy sector presentation deck to evaluate and analyze data and to track the performance. All the diagrams and tables used in this PowerPoint presentation are completely editable and can be used very easily. You can enter your calculated numbers in the excel sheet linked to the dashboard slides and can update them with the help of one click. This performance evaluation in energy sector PPT slides has-icon slides and many additional slides like timeline, comparison, quotes. etc. Download our energy audit and management PPT slides to create an impressive presentation. Counter inhibiting factors with our Performance Management In Energy Sector Powerpoint Presentation Slides. Allow for increased freedom of action.
- Google Slides is a new FREE Presentation software from Google.
- All our content is 100% compatible with Google Slides.
- Just download our designs, and upload them to Google Slides and they will work automatically.
- Amaze your audience with SlideTeam and Google Slides.
-
Want Changes to This PPT Slide? Check out our Presentation Design Services
- WideScreen Aspect ratio is becoming a very popular format. When you download this product, the downloaded ZIP will contain this product in both standard and widescreen format.
-

- Some older products that we have may only be in standard format, but they can easily be converted to widescreen.
- To do this, please open the SlideTeam product in Powerpoint, and go to
- Design ( On the top bar) -> Page Setup -> and select "On-screen Show (16:9)” in the drop down for "Slides Sized for".
- The slide or theme will change to widescreen, and all graphics will adjust automatically. You can similarly convert our content to any other desired screen aspect ratio.
Compatible With Google Slides

Get This In WideScreen
You must be logged in to download this presentation.
PowerPoint presentation slides
Presenting this set of slides with name - Performance Management In Energy Sector Powerpoint Presentation Slides. This PPT deck displays twenty-nine slides with in depth research. It showcases all kind of editable templates infographs for an inclusive and comprehensive Performance. The content is extensively researched, and the designs are professional. Our PPT designers have worked tirelessly to craft this deck using beautiful PowerPoint templates, graphics, diagrams, and icons. On top of that, the deck is 100 percent editable in PowerPoint so that you can enter your text in the placeholders, change colors if you wish to, Download PowerPoint templates in both widescreen and standard screen. The presentation is fully supported by Google Slides. It can be easily converted into JPG or PDF format.
People who downloaded this PowerPoint presentation also viewed the following :
Content of this Powerpoint Presentation
Slide 1: This slide introduces Performance Management in Energy Sector. State Your Company Name and begin.
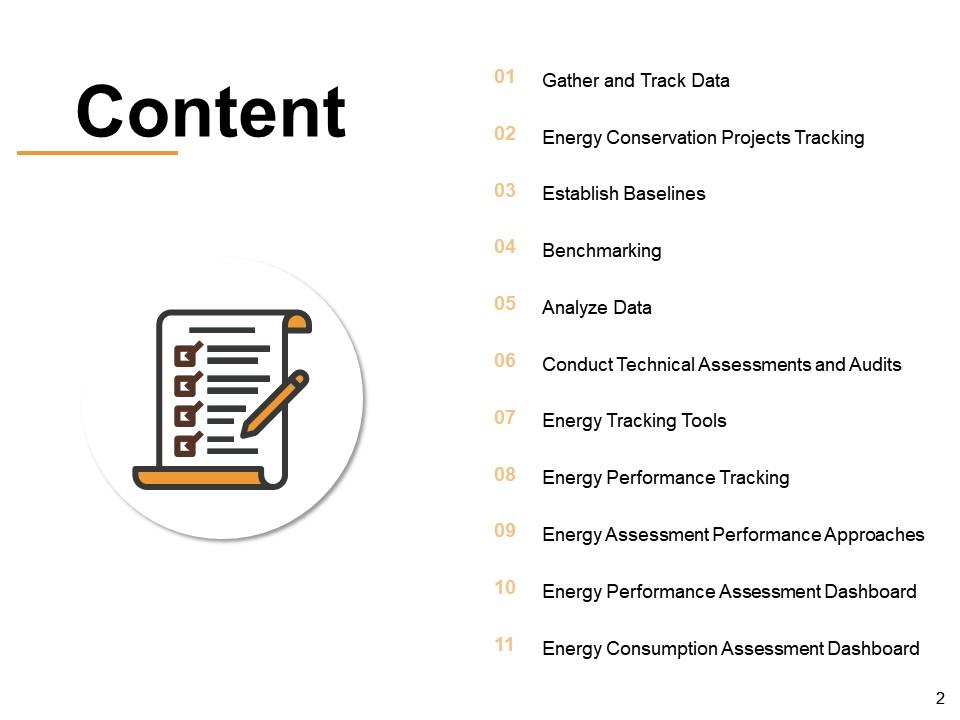
Slide 2: This slide shows Content of the presentation.
Slide 3: This slide shows Gather and Track Data with related imagery and additional text boxes to show data.
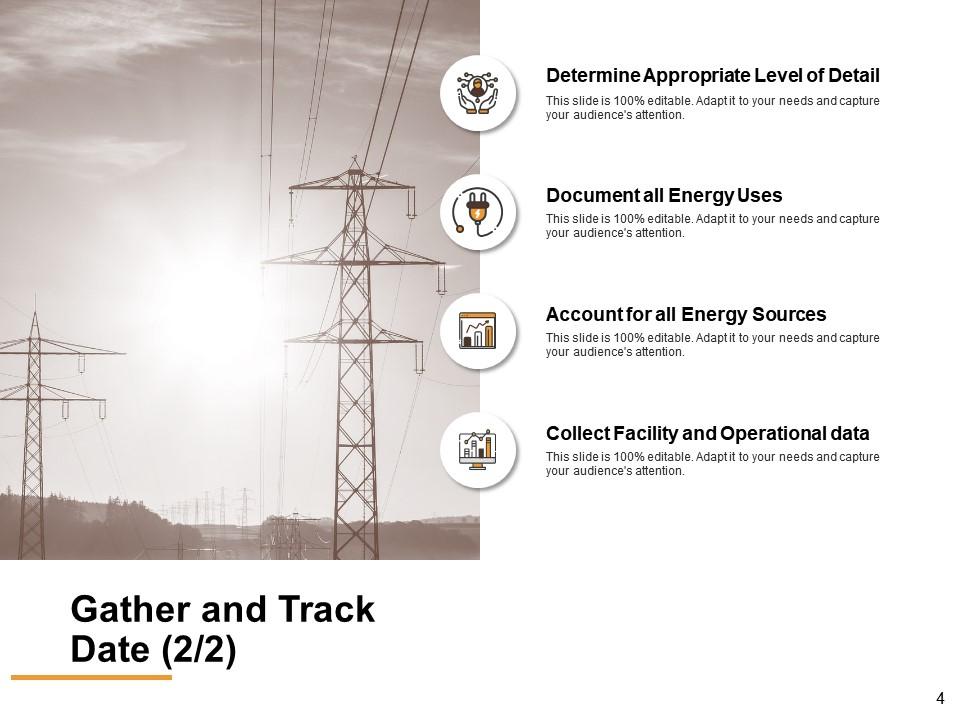
Slide 4: This is another slide showing Gather and Track Data.
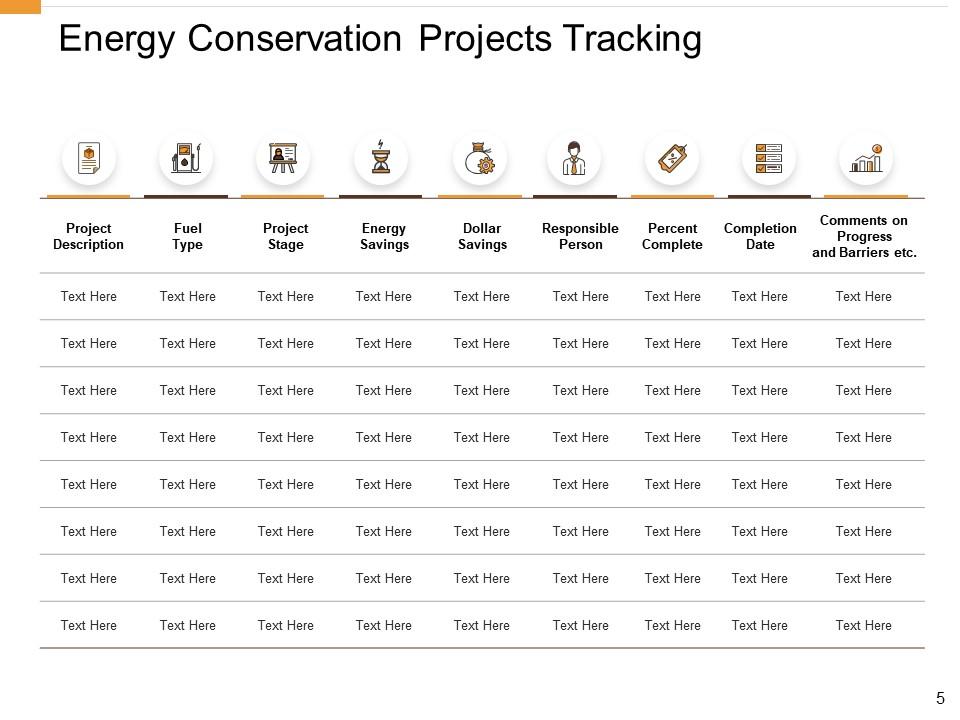
Slide 5: This slide displays Energy Conservation Projects Tracking in tabular form.
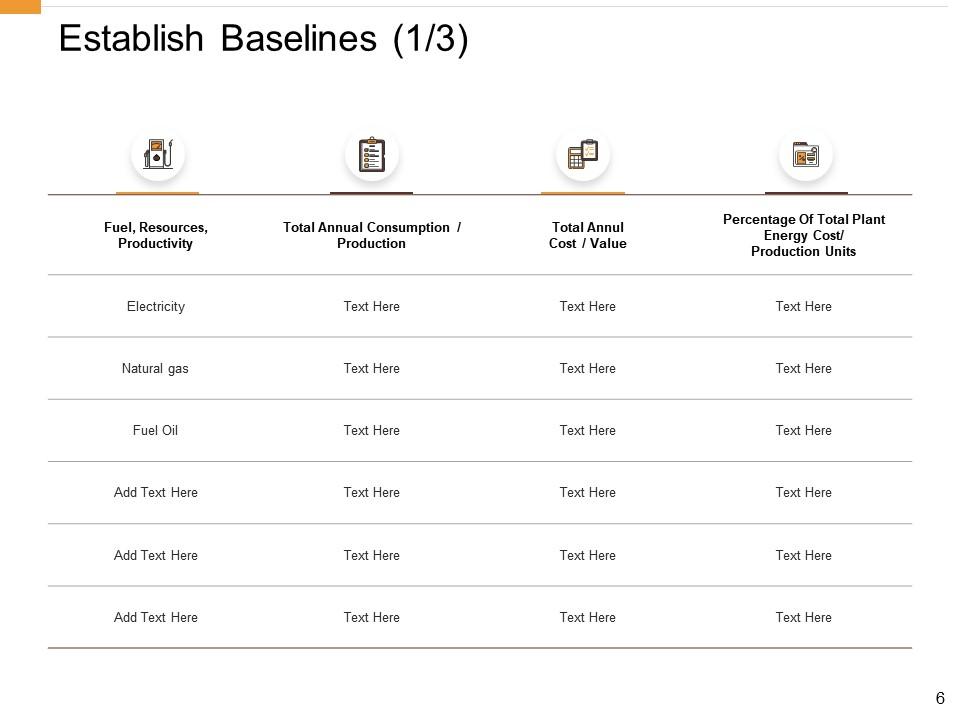
Slide 6: This slide presents Establish Baselines in tabular form. You can add or change data as per requirements.
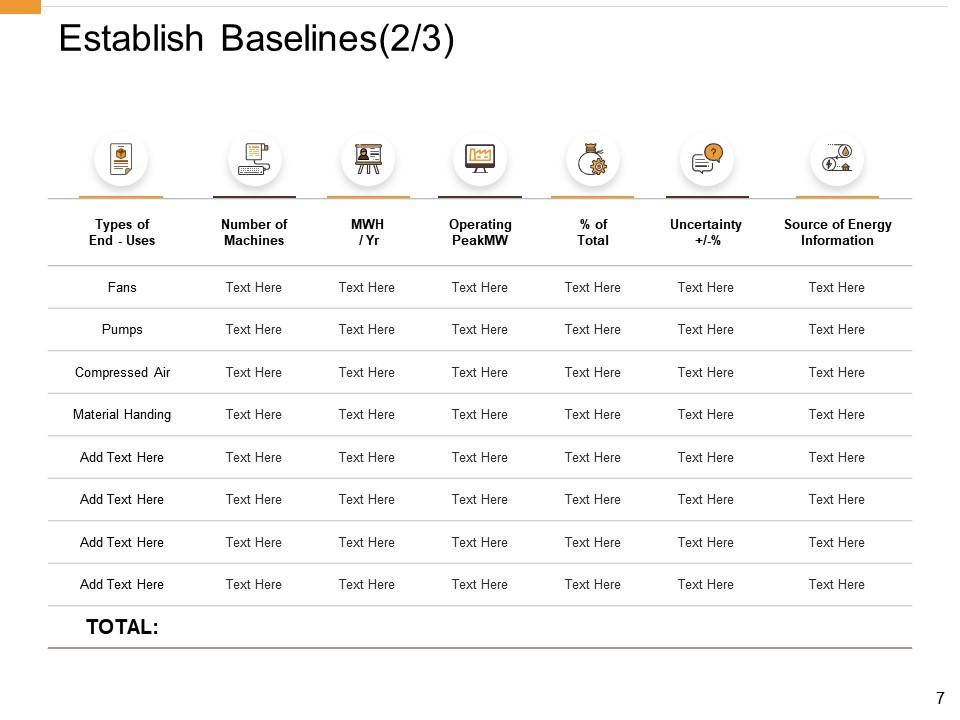
Slide 7: This is another slide on Establish Baselines.
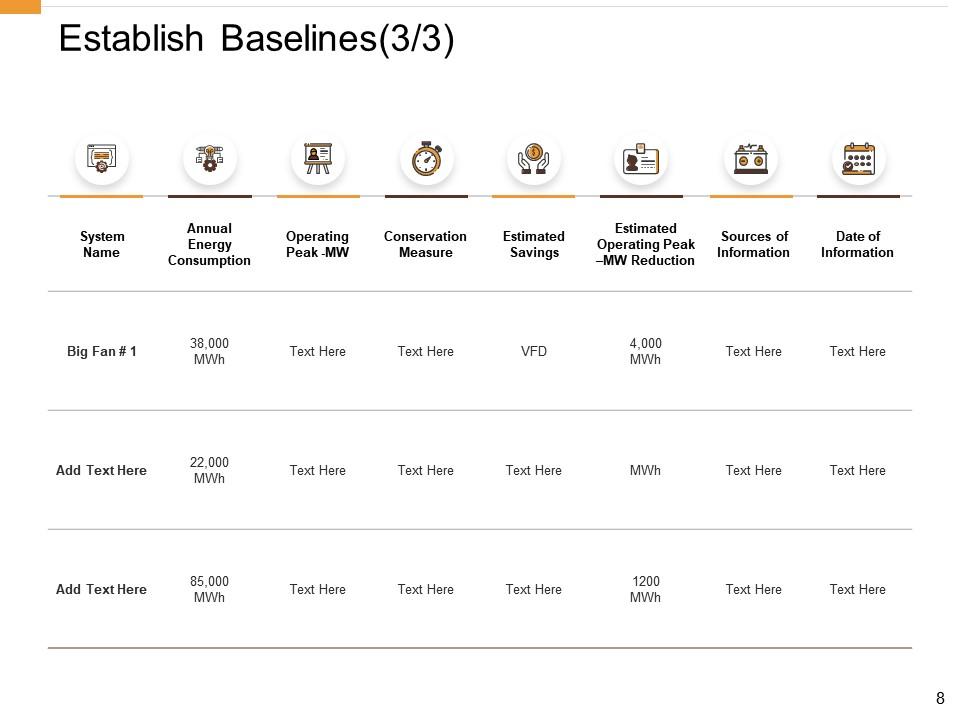
Slide 8: This is another slide on Establish Baselines.
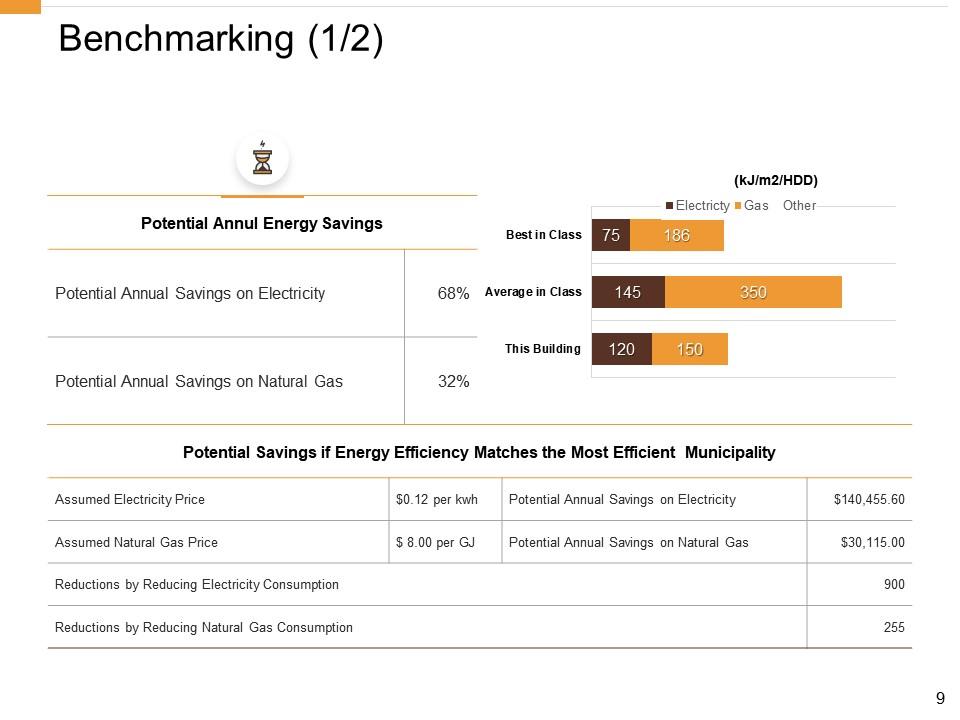
Slide 9: This slide showcases Benchmarking describing annual energy savings in tabular and graphical forms.
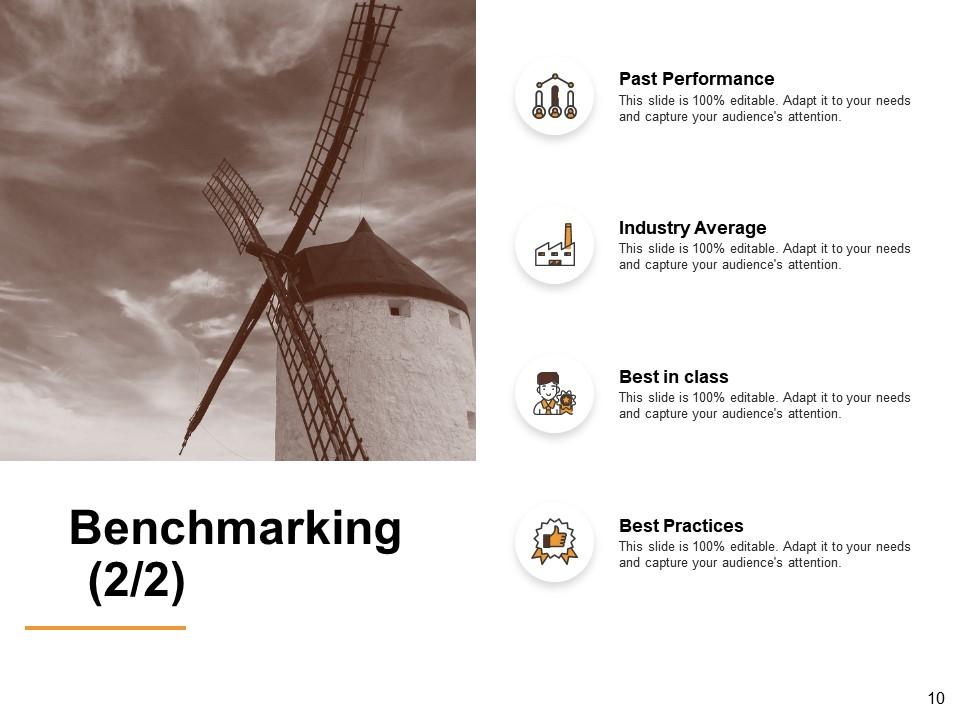
Slide 10: This slide shows Benchmarking describing- Past Performance, Industry Average, Best in Class, Best Practices.
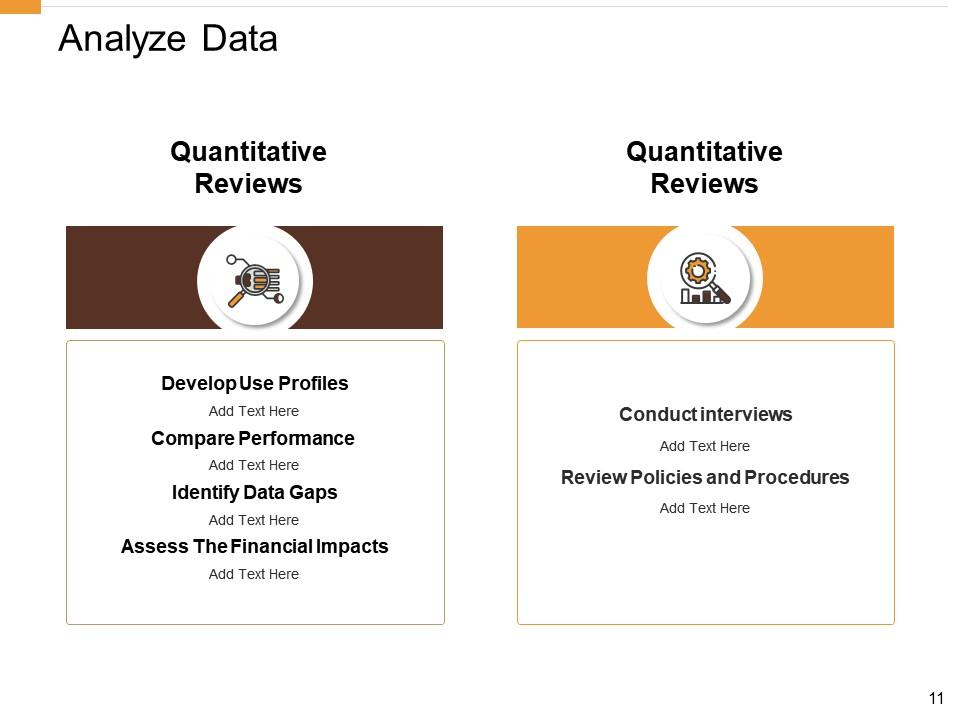
Slide 11: This slide presents Analyze Data with related imagery and text.
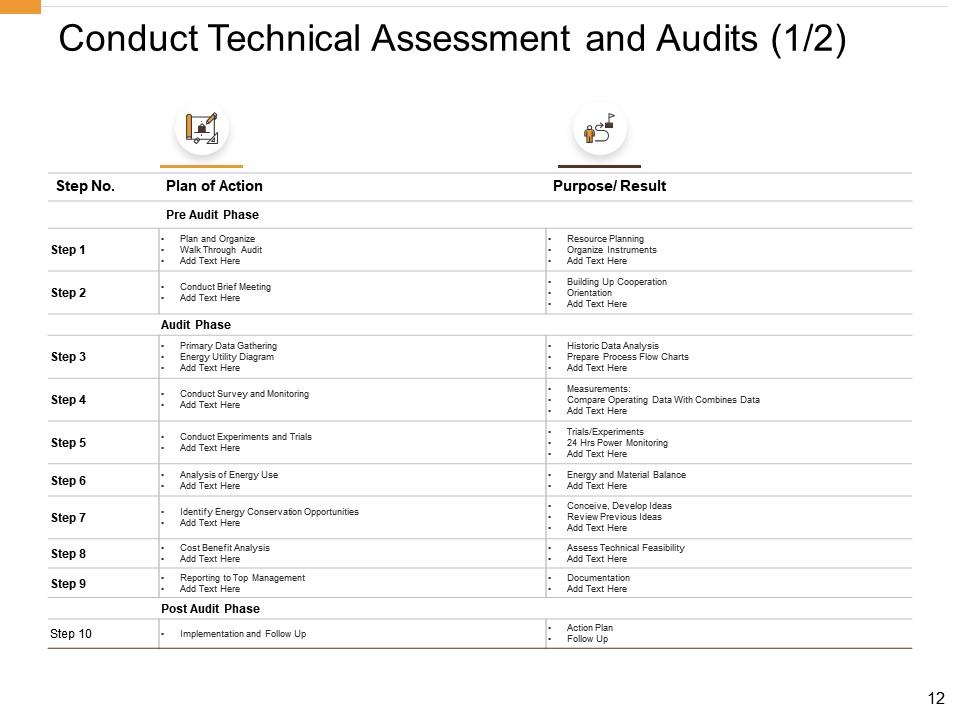
Slide 12: This slide displays Conduct Technical Assessment and Audits in tabular form.
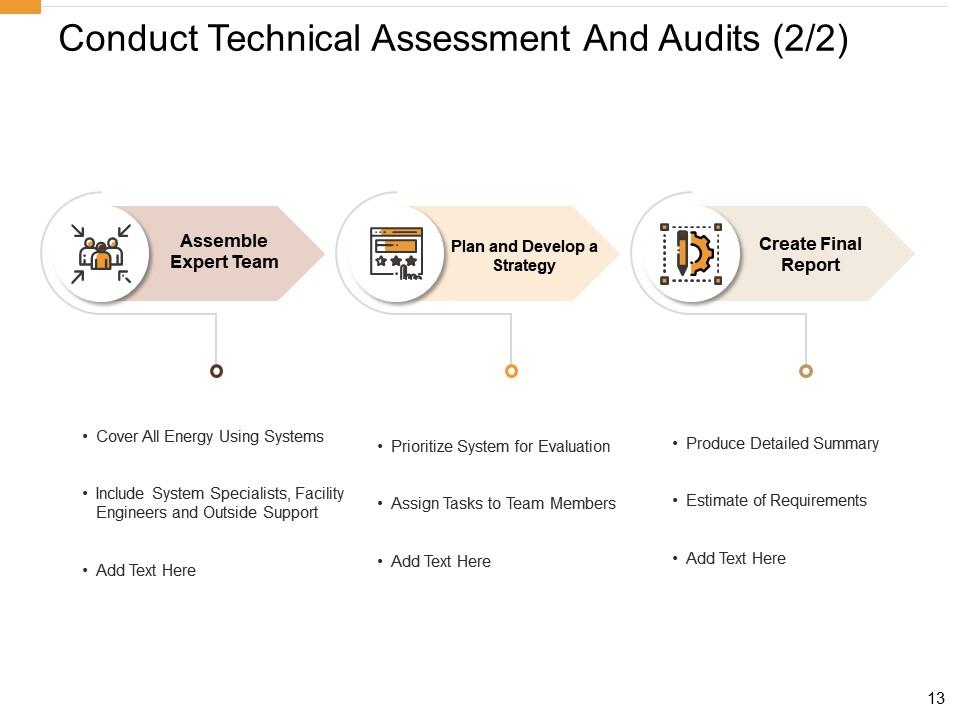
Slide 13: This is another slide to Conduct Technical Assessments and Audits.
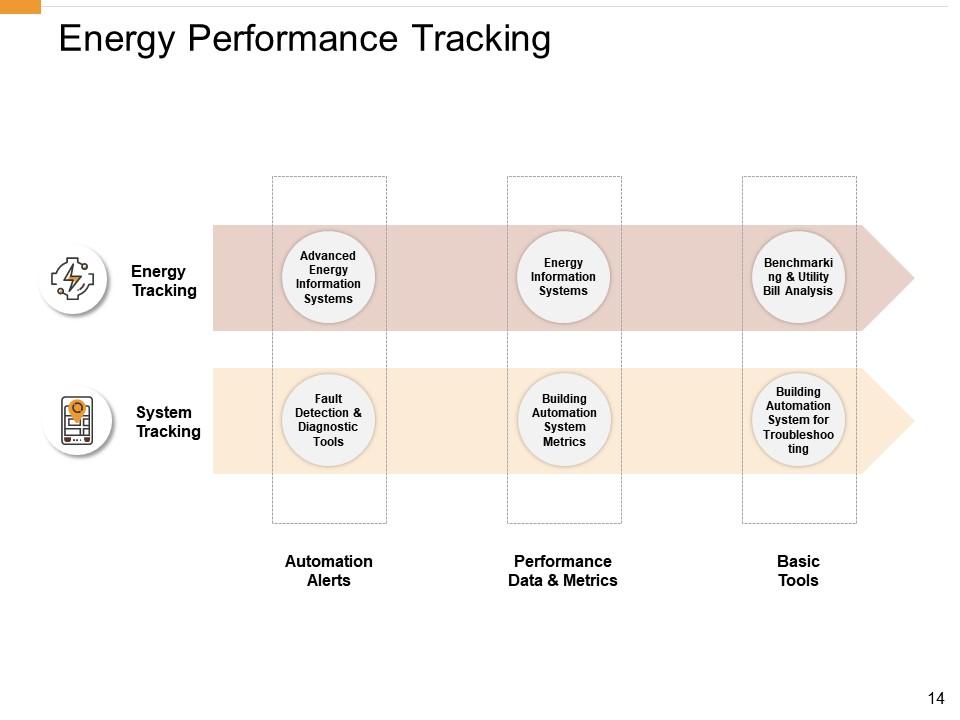
Slide 14: This slide represents Energy Performance Tracing describing- Automation Alerts, Performance Data & Metrics, Basic Tools.
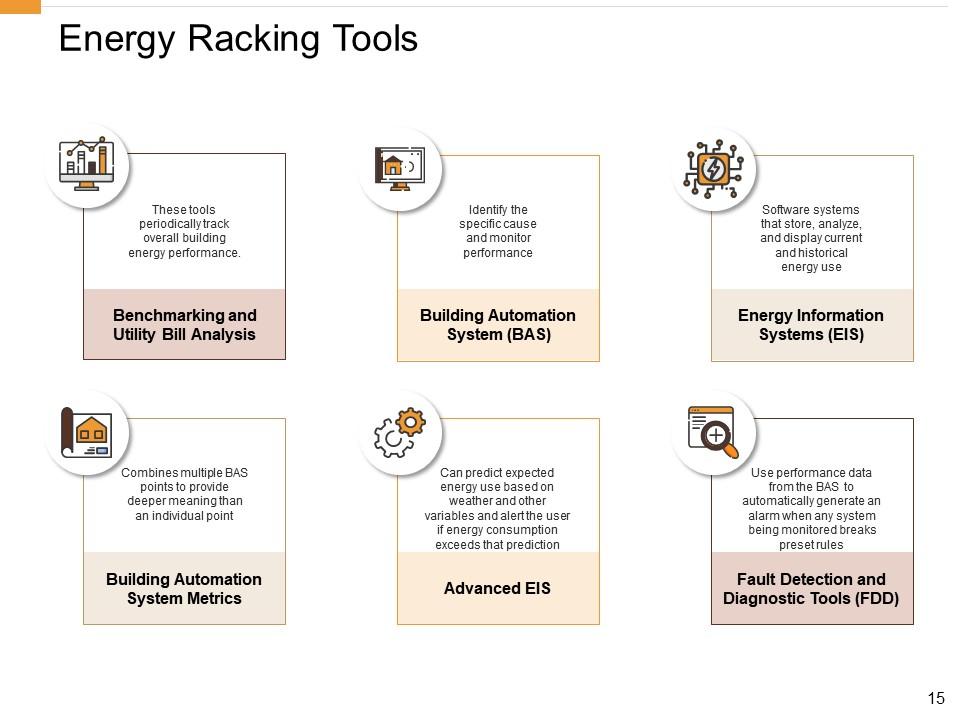
Slide 15: This slide showcases Energy Tracking Tools describing- Benchmarking and Utility Bill Analysis, Building Automation System (BAS), Energy Information Systems (EIS), Building Automation System Metrics, Advanced EIS, Fault Detection and Diagnostic Tools (FDD).
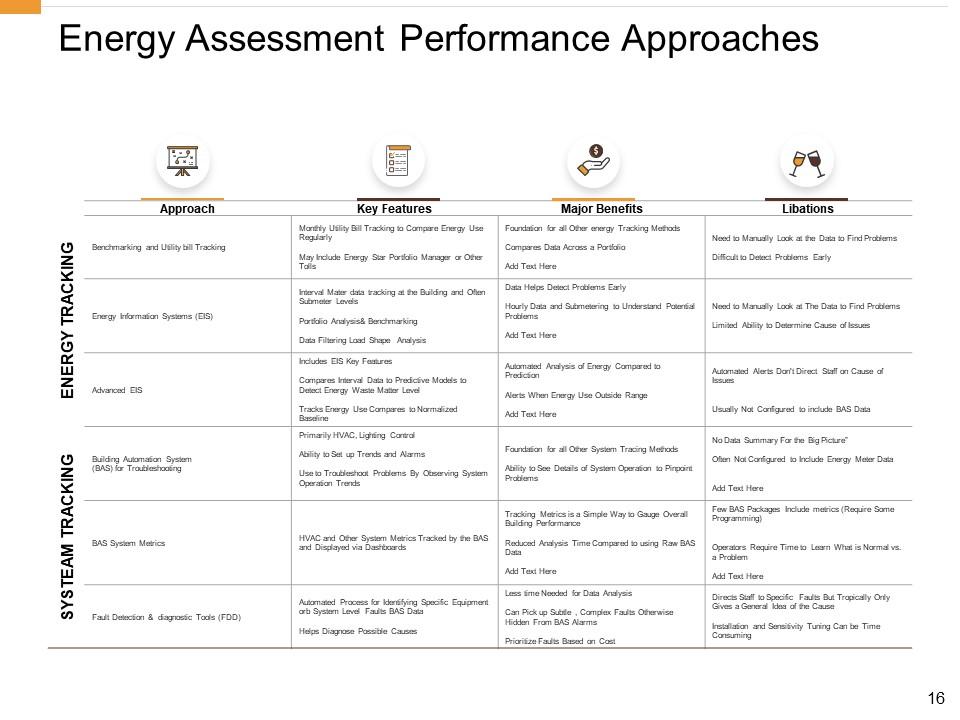
Slide 16: This slide shows Energy Assessment Performance Approaches in tabular form with categories as Approach, key features, major benefits and libations.
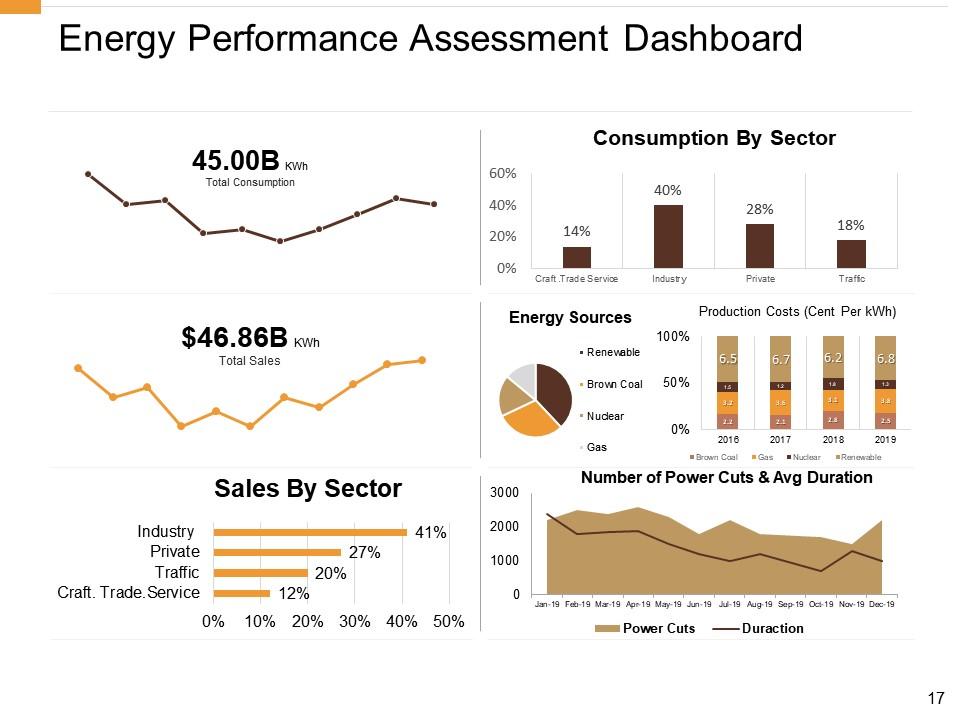
Slide 17: This slide presents Energy Performance Assessment Dashboard showing data in graphical form.
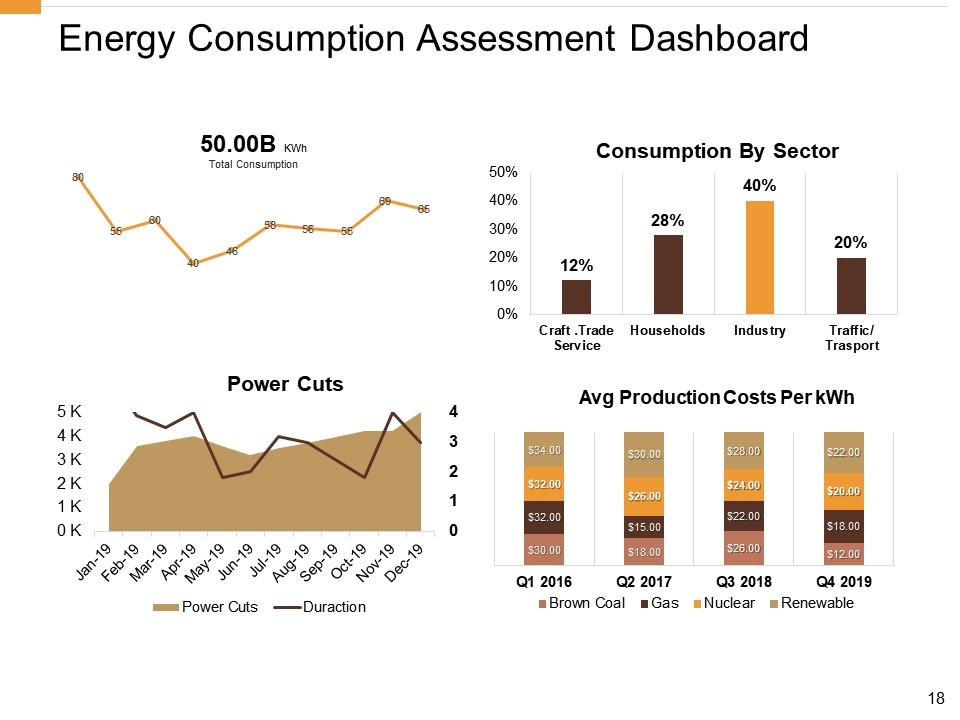
Slide 18: This slide displays Energy Consumption Assessment Dashboard.
Slide 19: This slide showcases Performance Management in Energy Sector Icons.
Slide 20: This is Our Team slide with names and designation.
Slide 21: This is About Us slide to show company specifications etc.
Slide 22: This is a Timeline slide to show information related with time period.
Slide 23: This is a Comparison slide to state comparison between commodities, entities etc.
Slide 24: This is a Quotes slide to convey message, beliefs etc.
Slide 25: This is Our Goal slide. Show your firm's goals here.
Slide 26: This slide is titled as Post It. Post your important notes here.
Slide 27: This is a Financial slide. Show your finance related stuff here.
Slide 28: This is a Bulb or Idea slide to state a new idea or highlight information, specifications etc.
Slide 29: This is a Thank you slide with address, contact numbers and email address.
Performance Management In Energy Sector Powerpoint Presentation Slides with all 29 slides:
Take a dive with our Performance Management In Energy Sector Powerpoint Presentation Slides. Your ideas will get a full ten points.
No Reviews


