

Pie Chart Bundle Powerpoint Ppt Templates And Slides





Try Before you Buy Download Free Sample Product
 Impress Your
Audience
 100%
Editable
 Save Hours
of Time


Our Pie Chart Bundle Powerpoint Ppt Templates And Slides are topically designed to provide an attractive backdrop to any subject. Use them to look like a presentation pro.
People who downloaded this PowerPoint presentation also viewed the following :
Pie Chart Bundle Powerpoint Ppt Templates And Slides with all 38 slides:
Use our Pie Chart Bundle Powerpoint Ppt Templates And Slides to effectively help you save your valuable time. They are readymade to fit into any presentation structure.

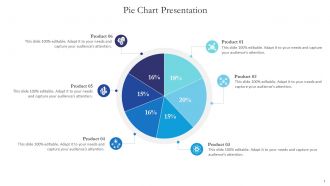
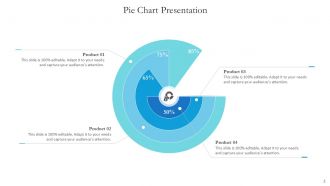









FAQs for Pie Chart Bundle Powerpoint Ppt
Honestly, pie charts can look awful if you're not careful with the colors - make sure there's enough contrast so people can actually tell segments apart. Don't go crazy with too many slices either, like 5-7 max or it just becomes a mess. I always put labels either right on the segments or use those little lines pointing to them, whatever looks cleaner. Oh and definitely add percentages next to your labels. People love seeing the actual numbers. Leave room for a decent title too. Those basics will cover you for pretty much any data you're working with.
Yeah, color choices can totally mess with how people interpret your pie chart data! Bright colors make small segments look way more important than they actually are. Meanwhile dull colors get ignored. People automatically think red = bad and green = good, whether you want that or not. Similar shades just confuse everyone - I learned that the hard way on a work presentation last month. You'll want high contrast colors that actually make sense for your data. Also think about what emotions each color might trigger, because that stuff matters more than you'd expect.
Don't go crazy with slices - 5 to 7 max or it gets messy. Start your biggest slice at 12 o'clock, makes it way easier to read. Colors should actually be different from each other (shocking concept, I know). Skip the 3D stuff - looks cool but totally warps your data. Those tiny slices under 5%? Nobody can see them anyway. Double-check your percentages add up to 100% because that's embarrassing when they don't. Pro tip: label directly on the slices instead of making people play detective with a legend.
Yeah, pie chart templates are super adaptable! Just plug in your data and they'll automatically resize all the slices based on your percentages. You can mess around with colors, fonts, labels - whatever matches your vibe. When you swap in new numbers later, everything rescales proportionally so you won't have to start over. Some templates let you "explode" certain slices to highlight them, or flip between 2D and 3D (though 3D looks cool but can be confusing to read honestly). Oh, and you can tweak legends, add those little data callout boxes, change color schemes. Just double-check your percentages add up to 100% first or things get weird!
So pie charts are clutch when you're showing parts of a whole - like where your money goes each month or market share stuff. Keep it to 3-7 categories though. More than that and it looks like a hot mess. They're great because you instantly see the proportional relationships without thinking too hard about it. Line charts track trends, bar charts compare things, but pie charts? They just make sense when you want that visual "slice" effect. Oh, and double-check your percentages add to 100% - I've definitely screwed that up before and felt dumb.
Dude, customizable pie charts are a game changer for presentations. You can match your brand colors instead of using those awful default ones that make everything look rushed. Clean visuals = people actually trust your data more. I learned this the hard way after bombing a client meeting with generic charts that looked terrible. When your visuals feel intentional and polished, audiences stay way more engaged. The trick is finding templates flexible enough for your specific data but not so blank that you're designing from zero every time. Saves you hours too.
Definitely go for templates with customizable colors that match your brand. Clear data labels with percentages are a must - nobody wants to guess what each slice represents. The ability to swap data easily without the whole thing falling apart is huge too. Oh, and make sure there's a decent legend because I swear people always make pie slices way too small to read. You'll need space for titles and source info, plus it should look good both on screen and printed. Templates that let you pull out specific slices for emphasis are pretty handy when you want to highlight something important.
Make your colors really pop against each other, but don't just rely on that - throw in some patterns or textures too. Big text is your friend here. I always slap the actual numbers right on each slice because squinting at tiny legends is the worst. Oh, and maybe toss in a basic data table next to it? Screen readers are basically useless with charts, so that covers everyone. Trust me, I once watched my boss struggle to read my chart during a presentation and it was painful. Short version: make it bold and readable for literally anyone who might see it.
Put labels right on the slices if they fit, otherwise use those connecting lines for tiny sections. Just a few words plus the percentage - nobody wants to read a novel on a pie chart. Contrasting colors are key so people can actually see the text. I learned this the hard way after making charts with white text on yellow backgrounds (oops). Start your biggest slice at the top and go clockwise. Makes everything look way more organized. Oh, and pick one style - either all labels inside or all outside. Mixing both looks sloppy.
Honestly, templates are a lifesaver for this stuff. You set up your colors, fonts, and layout once, then just plug in new data each time. No more starting from scratch or having charts that look totally different from each other. Your audience won't get confused by random design changes either - they can actually focus on comparing the numbers instead of wondering why one chart is blue and another is red. I probably spend way less time on formatting now. Just pick your brand colors upfront and stick with the same template for the whole report.
Honestly, just use Excel or Google Sheets if you need something quick - they're surprisingly decent for basic pie charts. Canva's where I'd go next though, their templates actually look professional without much effort. Power BI and Tableau are solid if you're doing serious data stuff, but fair warning, they're kinda overwhelming at first. Adobe Illustrator gives you total control but seems like overkill unless you're presenting to executives or something. I'd probably start with whatever you already have and see if it works.
Honestly, animated pie charts are so much better for time-based data than those boring static ones. The movement actually shows your story happening instead of making people guess what changed between snapshots. Growing market shares, budget shifts, user behavior - all way more obvious when you can watch it evolve. People actually watch them too, which is half the battle with data presentations. The eye naturally follows the biggest changes as they happen. Only thing is don't make the animation too zippy or you'll lose everyone. Oh and definitely add time labels so people can track what's happening when.
Honestly, pie charts are perfect when you need to show how things break down as parts of a whole. Way better than just listing percentages - nobody wants to do math in their head during your presentation. Templates save you from starting with a blank canvas every time, which is honestly a lifesaver when you're rushing to finish slides. The visual impact hits immediately too. People can glance at it and instantly get what portion each slice represents. Just grab a template that doesn't clash with your overall design and plug in your numbers. Takes like 30 seconds versus building one from scratch.
Honestly, pie charts kinda suck for multiple data series. They're meant to show one thing broken into parts, you know? You'd need separate pies for each series, which gets messy fast. Better off switching to stacked bars or grouped columns - way clearer for your audience. I mean, everyone thinks pie charts look nice, but they're not always the right tool. If you're really stuck on pies though, find templates that do "small multiples" where you get several mini pies side by side. Just don't cram complex data into a simple pie format.
So basically, 3D pie charts mess with how your brain reads the data. Slices in front look way bigger than they actually are, while the ones angled away seem tiny. Super misleading! With 2D charts, everything's on the same level so you can actually compare the sizes properly. I know the 3D ones look cooler - I used to use them all the time in college presentations thinking I was being fancy. But honestly? Your audience will get confused trying to figure out the real proportions. Just go with 2D if you want people to understand what you're showing them.
-
Very unique, user-friendly presentation interface.
-
“Thank you to the SlideTeam. Your presentations look really skillful and have made my life so much easier.”