


Prioritization Scoring Model A Tool For Evaluating Project Value Powerpoint Presentation Slides





Try Before you Buy Download Free Sample Product
 Impress Your
 Audience
 100%
100% Editable
 Save Hours
 of Time


Our Prioritization Scoring Model A Tool For Evaluating Project Value Powerpoint Presentation Slides are topically designed to provide an attractive backdrop to any subject. Use them to look like a presentation pro.
People who downloaded this PowerPoint presentation also viewed the following :
Content of this Powerpoint Presentation
Slide 1: This slide introduces Prioritization Scoring Model a Tool for Evaluating Project Value.
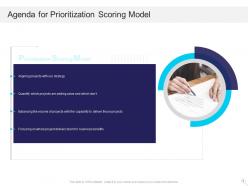
Slide 2: This slide displays Agenda for Prioritization Scoring Model
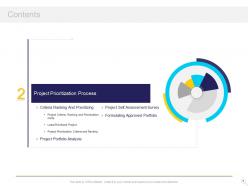
Slide 3: This slide displays Contents.
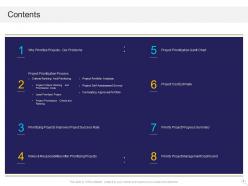
Slide 4: This slide displays Contents of the presentation.
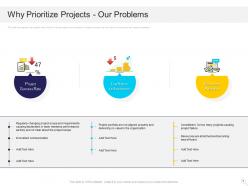
Slide 5: This slide has captured the problem area of the firm for the project such as decline in project success rate, low return on investment and resource allocation.
Slide 6: This slide displays Contents.
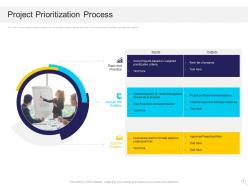
Slide 7: This slide is covers project portfolio analysis and prioritization process starting from rank and prioritize, analyze portfolio and approved portfolio.
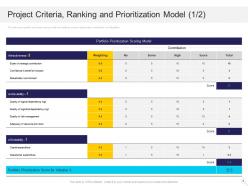
Slide 8: This slide covers portfolio prioritization scoring model with weighting score for attractiveness, achievability and affordability.
Slide 9: This slide covers different projects and prioritization criteria and score for each project along with weighted score. Here least scored project determines the lowest priority.
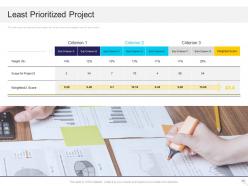
Slide 10: This slide covers the least prioritized project and its sub criteria with weighted score for each criteria.
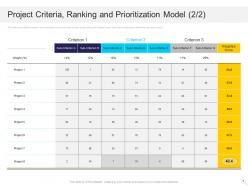
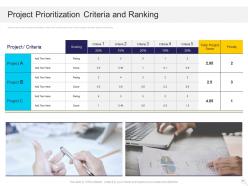
Slide 11: This slide covers project prioritization criteria with ranking and score of each project and total project with priority.
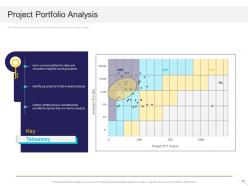
Slide 12: This slide covers high scoring projects and identifying those projects by plotting on graph.
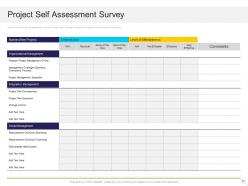
Slide 13: This slide covers self assessment survey for project team members to analyze the factors driving success of the project.
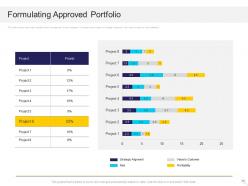
Slide 14: This slide portrays new project portfolio which are approved by the managers. It includes priority based on strategic alignment, risk, value to customer and profitability.
Slide 15: This slide displays Contents
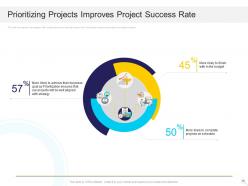
Slide 16: This slide has captured the progress after implementing the prioritizing process thus, Prioritization ensures that projects are aligned properly.
Slide 17: This slide displays Contents.
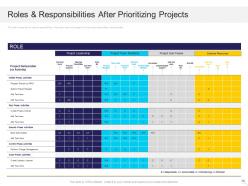
Slide 18: This slide is capturing the roles & responsibilities of the project team with respect to all the project deliverables using this table.
Slide 19: This slide displays Contents
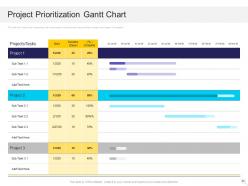
Slide 20: This slide has a Gantt chart representing the various tasks to be performed along with there duration and degree of completion.
Slide 21: This slide depicts Contents
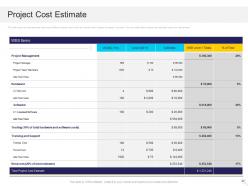
Slide 22: This slide covers the cost estimates split across different sections which would be involved while bringing the project in to action. You can modify these sections and estimates as per the requirements.
Slide 23: This slide displays Contents.
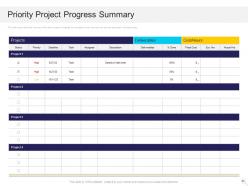
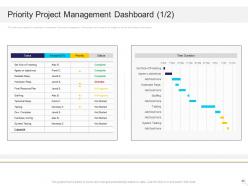
Slide 24: This slide covers the broad summary of the entire project to highlight the completion level, its priority and the cost associated with these tasks.
Slide 25: This slide displays Contents.
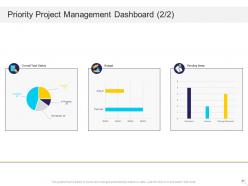
Slide 26: This slide covers graphical presentation to understand the overall management of the project and to analyze the budget as well as the timelines of the project.
Slide 27: This slide shows Priority Project Management Dashboard.
Slide 28: This is Prioritization Scoring Model a Tool for Evaluating Project Value Icons Slide.
Slide 29: This slide is titled as Additional Slides for moving forward.
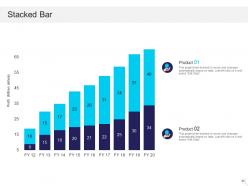
Slide 30: This slide represents Stacked Bar chart for product comparison.
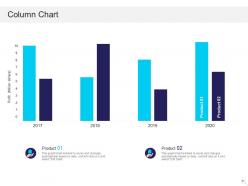
Slide 31: This slide displays Column Chart for moving forward.
Slide 32: This is Our Team slide with Names and Designations.
Slide 33: This is About Us slide to showcase Company specifications.
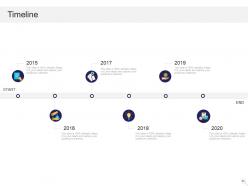
Slide 34: This slide displays Timeline process.
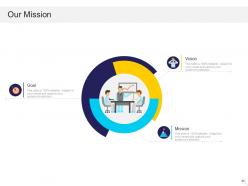
Slide 35: This slide displays Our Mission, Vision and Goals.
Slide 36: This slide displays Our Target
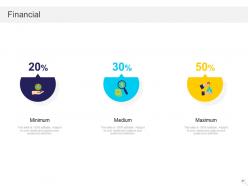
Slide 37: This is Financial slide. Showcase Finance related stuff.
Slide 38: This is Idea Generation slide to highlight important beliefs, facts etc.
Slide 39: This is Thank You slide with Contact details.
Prioritization Scoring Model A Tool For Evaluating Project Value Powerpoint Presentation Slides with all 39 slides:
Use our Prioritization Scoring Model A Tool For Evaluating Project Value Powerpoint Presentation Slides to effectively help you save your valuable time. They are readymade to fit into any presentation structure.




FAQs for Prioritization Scoring Model A Tool For Evaluating Project Value
You gotta figure out your scoring criteria first - what actually matters for your decisions? Impact, effort, risk, whatever makes sense. Then decide how much weight each one gets because they're definitely not all equal. Make sure you can reliably measure this stuff or you'll just get junk data. Honestly, I'd test it on some old decisions first to see if it would've worked. The biggest thing though? Don't overcomplicate it. I've seen people build these insanely complex systems that nobody ends up using. Keep it simple enough that your team will actually stick with it consistently.
First thing - make sure your scoring actually matches what the company cares about right now. Growth mode? Weight revenue impact way higher. And honestly, get the executives to approve your weightings upfront because there's nothing more frustrating than them questioning everything later. Pull in people from different teams when you're setting this up so nobody feels left out. Company priorities change fast though - like what mattered in January might be irrelevant by summer. I'd probably do quarterly check-ins to make sure you're still on track with where the business is actually heading.
Honestly, I'd just start with **expert judgment** - have your team assign weights based on what they think matters most. Super simple. **Pairwise comparison** is another good route where you pit each criterion against the others to see which wins out. The **100-point method** lets you divvy up points across criteria, though it gets annoying with tons of them. **Analytical hierarchy process** exists if you're into heavy math (personally think it's overkill for most situations). Don't overthink it though - expert judgment first, then tweak once you see how things shake out.
So instead of collecting feedback after the fact, bake stakeholder input right into your scoring from the start. Have them actually sit in on scoring sessions - seriously, this will save you weeks of endless revision cycles. Set up weighted categories based on what each group cares about most (revenue potential, customer impact, technical stuff, whatever). Dot voting works great for this, or just have people rank things. The trick is making everyone feel heard without turning it into one of those meetings that could've been an email. Keep it structured enough that you can actually make decisions instead of just talking in circles.
Don't overcomplicate your scoring - like, seriously. Keep it simple with a 1-5 scale and actually define what each number means with real examples. Otherwise you'll get wildly inconsistent results. Make sure the loudest person doesn't hijack everything (ugh, we both know that type). Get input from different people who actually matter for the decision. Here's what really gets me though - so many people build these models then never look back to see if they're working. Start small, test on maybe 10-20 items first, then tweak it. Way easier than fixing a mess later.
Make a simple rating scale first - like 1-5 where each number means something specific. So "1 = nightmare to implement" and "5 = super easy." Honestly, the hardest part is staying consistent when you're scoring stuff. Get a couple other people to rate the same things separately, then average everything out. Trust me on this - your own bias is sneaky. Oh, and write down what your scale actually means! I've made spreadsheets where I had no clue what past-me was thinking with "medium priority." Start basic with 3-5 points max. You can get fancy with weighted formulas later if you really want to.
Honestly, tech makes scoring models so much easier. Start with basic Excel formulas - they'll calculate everything automatically when you tweak weights, which saves tons of time. Dashboards are clutch for showing patterns to your team (way better than staring at spreadsheets all day). AI tools can actually analyze your past projects to figure out which criteria really matter - pretty cool stuff. Oh, and collaborative platforms let everyone score simultaneously so you can see where people agree. I'd probably just start simple with spreadsheets first. You can always upgrade to fancier software once you get the hang of it.
Track whether your high-scored items actually deliver what you expected - that's the main thing. I'd check delivery success rates and stakeholder satisfaction scores. Are you hitting strategic goals more consistently now? Also, honestly, adoption rates matter more than people think - if teams aren't using it, who cares how good it is? Compare performance against your old gut-feel decisions quarterly. The chaos test is key too. Do decisions feel less random and easier to defend? Success rates between scored vs unscored items will tell you everything.
Risk assessment is just another scoring piece in your prioritization model - helps you balance potential downsides with the good stuff. Score each project on things like implementation risk, resource issues, failure potential. Honestly feels like busy work at first, but it saves you from those projects that seem amazing until they completely blow up your team. Those risk scores get mixed in with your impact and feasibility ratings for better rankings. Oh and definitely start with maybe 3-4 risk factors that actually matter for your situation - don't overthink it.
Get your team involved in creating the scoring criteria from the start - don't just drop a finished framework on them. Show them your reasoning behind each criterion and how the weighting actually works. Honestly, I've watched so many of these things crash and burn because people felt shut out of the process. Let them push back on the criteria if they have good points. When you start scoring, keep everything visible and walk through any tough calls. Oh, and definitely explain the controversial decisions - that stuff always comes back to bite you otherwise. Make it collaborative upfront and you'll save yourself tons of headaches later.
Check your scoring model every quarter - see which high-scoring stuff actually worked vs. what flopped. That gap shows where you're off. Markets shift, so your priorities should too (learned this the hard way). When you notice patterns your current model misses, throw in new criteria. Sometimes you gotta completely ditch dimensions that stopped being useful. Oh and definitely keep notes on what changes you made - comparing decision quality before/after is pretty eye-opening. Don't get married to your original model like I did!
Dude, the way you show your scoring results totally changes how people react to them. Heat maps and clean charts help executives spot patterns way faster than boring spreadsheets - I've literally watched people flip their opinions once they see the visual version. It's crazy how much presentation format affects decision-making. Short lists work great too. The key thing is explaining WHY something scored high or low, not just throwing numbers at people. When stakeholders can actually see which projects bubble to the top, you'll get buy-in so much easier. Trust me on this one.
Think of scenario analysis as stress-testing your priorities with different "what if" situations. Run your rankings through best case, worst case, and most likely scenarios - see what holds up when budgets get slashed or timelines go crazy (which honestly happens more than we'd like). Some priorities will stay rock solid while others flip completely. That's actually the good stuff - now you know which decisions are bulletproof and which ones need backup plans. The real win? You'll spot warning signs early so you're not scrambling when things inevitably change. Start with those three scenarios I mentioned.
Just tweak the criteria based on what actually matters for your thing. Tech projects? Weight technical feasibility super heavy. Marketing stuff focuses more on reach and brand fit instead. I've watched teams completely change their criteria when switching industries - healthcare suddenly makes compliance everything, you know? Start with whatever drives success in your sector, then adjust the scoring weights from there. Way better than generic business metrics that don't mean much to anyone. Your stakeholders will actually get it when you speak their language.
Look, your prioritization system is basically useless if you don't check how things actually turn out. Are those "high-priority" features you shipped really making a difference? Most teams just set up their scoring system once and forget about it - huge mistake. Track what happens after you launch stuff. Compare what you predicted would work versus reality. Then tweak your scoring weights based on real data. I worked with one team that used the same broken model for like 6 months because nobody bothered looking back. Don't be them. Your future calls will be way better.
-
Amazing product with appealing content and design.