

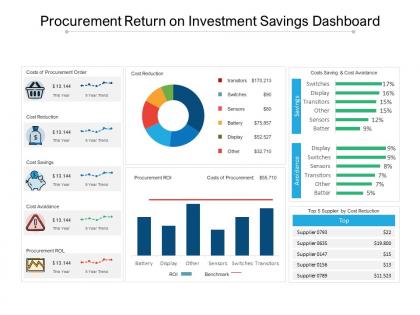
Procurement return on investment savings dashboard





Try Before you Buy Download Free Sample Product
 Impress Your
 Audience
 100%
100% Editable
 Save Hours
 of Time


Be done before due date with our Procurement Return On Investment Savings Dashboard. Always be the early bird.
People who downloaded this PowerPoint presentation also viewed the following :
Procurement return on investment savings dashboard with all 5 slides:
Become an early bird with our Procurement Return On Investment Savings Dashboard. You will always be done before due date.
FAQs for Procurement return on
Focus on cost savings first - both the obvious stuff and softer savings. Then track supplier performance like delivery times and quality scores. Contract compliance rates matter too, plus how much of your total spend you're actually controlling (vs people going rogue and buying whatever). Honestly, cycle times for sourcing and purchase-to-pay efficiency can make or break your sanity. Throw in supplier diversity if your company cares about that. Don't go overboard though - maybe 6-8 solid KPIs max that actually connect to what the business wants. Start with whatever keeps your stakeholders happy.
Honestly, visual elements are a game changer for procurement dashboards. Nobody wants to stare at endless spreadsheet rows - trust me on this one. Color coding is your friend: green for hitting savings targets, red for problem areas. Charts help people spot trends right away instead of hunting through data. Heat maps are perfect for supplier performance too. Oh, and keep it stupid simple. If your CEO needs more than 10 seconds to get it, you've overcomplicated things. Clean design wins every time.
Honestly, just stick to the basics first - track your spend, supplier performance, and actual savings. Bar charts and trend lines are your friends here. Don't even think about pie charts, they're absolutely terrible for quick comparisons. Keep colors consistent but throw in red/yellow alerts when something's off. You'll want automatic data refresh too, because showing up to meetings with stale numbers is awkward. Oh, and resist the urge to cram everything in at once - start with maybe 3-5 key metrics max. Users get overwhelmed otherwise, then nobody uses the thing.
Honestly, real-time data is a total game changer for procurement. You can catch supplier delays by 10 AM and have backup plans sorted by lunch – no more waiting around for monthly reports that are already outdated. Price changes, performance issues, compliance problems... you're seeing everything as it happens. My old boss used to say "data is only as good as how fresh it is" and he wasn't wrong. The trick is setting up smart alerts for what actually matters to your team. Otherwise you'll get buried in notifications and miss the important stuff. Having current market data during negotiations beats using last quarter's numbers every single time.
Look, if your procurement dashboard confuses people, they just won't use it - doesn't matter how good your data is. Make sure executives can spot trends immediately while still letting procurement folks dig into the details. I'd go with that progressive disclosure thing where you show the big picture first, then users click for more info. Test it with real people ASAP though, seriously. Can't tell you how many fancy dashboards I've seen that just collect dust because nobody could figure them out. Oh and keep the layout super intuitive - clear charts, logical flow, all that basic stuff.
Track three main things: hard savings (actual cost cuts from negotiations), soft savings (dodging price increases), and cost avoidance (skipping expensive alternatives). Set up a dashboard showing baseline spend vs your negotiated rates, then multiply by volume for total impact. Getting everyone to agree on what counts as "real" savings is honestly a nightmare that never ends. Build in timestamps and approval workflows so you can back everything up. Oh, and definitely tie your numbers back to budget variance reports - finance needs to validate this stuff or you'll just look like you're making things up.
Honestly, I'd go with Power BI first - it plays nice with most ERP systems and stuff like SAP Ariba. Tableau looks prettier but costs way more (unless your execs are really into fancy charts). Excel works too if money's tight. For live data, you'll probably need API connections or something like SpendHQ. Oh, and make sure whatever you pick actually connects to your current systems without needing a computer science degree to figure out. That's been my biggest headache with these tools.
So basically, a Procurement ROI Dashboard shows you in real-time which suppliers are actually worth your money vs the ones that just talk a good game. You can see cost savings, delivery times, quality scores - all that stuff in one spot. Honestly makes those quarterly reviews so much easier (used to hate prepping for those). Helps you spot your rockstar suppliers and catch the duds before they screw something up. Oh, and the data makes conversations with suppliers way less awkward when you need to call out issues. I'd start with just your biggest 5-10 suppliers though.
Focus on the stuff that actually matters to finance - spend reduction percentages, contract compliance, supplier scores. That's what hits the bottom line. Cost avoidance is tricky since CFOs hate calling savings "theoretical," but track it anyway. Your cycle times matter too because faster procurement = better cash flow. Honestly, the biggest win is showing total cost of ownership improvements and how your sourcing work affects gross margins. Set up monthly dashboards so you're not scrambling to prove your worth when budget season rolls around. Way easier than trying to explain procurement value in some PowerPoint.
So basically, that dashboard shows you where your procurement is screwing up - late deliveries, cost overruns, time wasted on boring manual stuff. You get this real-time view of what's actually broken instead of just guessing. Look for patterns first - like which suppliers are always behind schedule or what categories blow their budgets. Honestly, the lowest-performing metrics are usually where you'll see the biggest improvements fast. It's like having a heat map but for all your procurement headaches, which sounds nerdy but it's actually super helpful.
Ugh, data quality is gonna be your biggest headache - trust me on this one. Your procurement info is probably spread across like 5 different systems, so consolidating everything takes forever. Getting stakeholders to actually trust the numbers? Good luck with that initially. Everyone's got their own definition of what ROI means too, which makes picking the right KPIs tricky. Oh, and teams already drowning in reports will probably roll their eyes at another dashboard. My advice? Start small with whatever clean data you can actually rely on, and definitely get the key people involved in choosing metrics from day one.
Honestly, getting feedback from your stakeholders is make-or-break for dashboards. Without it, you're basically guessing at what matters to people. Finance teams obsess over cost savings while ops folks want supplier performance metrics - totally different priorities. I've seen so many dashboards fail because they tracked meaningless vanity metrics instead of asking users what they actually need. Different people interpret the same data in wildly different ways too, which always surprises me. Set up monthly check-ins with your main users. Keep tweaking based on what they tell you - it's the only way to build something people will actually use.
So predictive analytics is pretty cool - it's like upgrading from looking backward at what happened to actually seeing what's coming. You can spot future savings, catch supplier problems before they blow up, and figure out which strategies will actually work. Way better than just "hey we saved 12% last quarter" and calling it a day. It helps you see patterns too, like when prices always spike or contracts that need renewing soon. Honestly, the early warning stuff is where it really shines. Look for dashboards with spend forecasting and supplier predictions first - those two will totally change how you plan everything.
Start with solid data governance right away - figure out who owns which data and create validation rules. Automate everything you can because manual entry is where things get messy (seriously, people will categorize office supplies as "strategic consulting" if you let them). Connect automated feeds from your ERP and supplier systems to cut down on mistakes. Monthly spot checks are your friend - dig into any weird numbers that pop up. Oh, and make sure your team knows the standards for categorizing stuff. Consistency matters way more than you'd think when everyone's entering purchase data differently.
Benchmarking is your reality check – turns those procurement ROI numbers into something you can actually use. Like, if you're hitting 15% cost savings, is that good or trash? You literally can't tell without comparing it to industry standards or your past performance. It's like grading a test when you don't know what counts as an A, you know? Your dashboard gets so much better when you can stack your metrics against competitors or last quarter's numbers. Honestly, I'd pick 2-3 benchmarks that your boss actually cares about first, then expand later.
No Reviews