


Product Lifecycle And Market Analysis Powerpoint Presentation Slides





Try Before you Buy Download Free Sample Product
 Impress Your
 Audience
 100%
100% Editable
 Save Hours
 of Time


To get compliments on your business presentation you need professional PowerPoint templates, we have the best templates on our website that can help you. Our content-ready product lifecycle and market analysis PowerPoint presentation has been efficiently designed for specific purposes. This product development PowerPoint slide is helpful to present stages of product lifecycle. Product management PPT design is a set of 68 slides such as detailed overview, idea screening, understanding customer needs,, category analysis that help to distinguish company and its products from their competitors, intending to create an everlasting impression in the minds of the customers. You can use this product development PowerPoint template to create a presentation on product lifecycle management plan, marketing strategies, lifecycle stages, positioning, brand strategy, brand development and marketing, product promotion, marketing lifecycle. The product lifecycle and market analysis PowerPoint templates can add extra effects to your presentation and make it more eye-catching. Don't allow instigators to foment chaos with our Product Lifecycle And Market Analysis Powerpoint Presentation Slides. Expose the falsehoods being generated.
People who downloaded this PowerPoint presentation also viewed the following :
Content of this Powerpoint Presentation
Slide 1: This slide presents Product Lifecycle and Market Analysis.State Your Company Name and begin.
Slide 2: This slide showcases Agenda. You can add the company agenda and make it accordingly.
Slide 3: This slide shows Outline with these nine points- Market Analysis, Product Idea Screening, New Product Analysis, Tools & Techniques, Product Lifecycle, Development Plans, Branding & Repositioning, Product Feasibility & Review, Cost Analysis.
Slide 4: This slide shows Product Idea Screening with these six factors- New Product Introduction, New Product Detailed Overview, Understanding Customer Needs, External Sources of Ideas, Internal Sources of Ideas, Product Roadmap.
Slide 5: This slide presents New Product Introduction. Now is the best time to explain your product idea in an effective manner so that the audience gets immersed in it right from the beginning
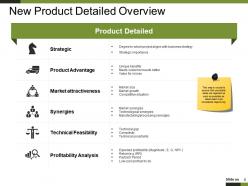
Slide 6: This slide showcases New Product Detailed Overview. This step is crucial to ensure that unsuitable ideas are rejected as soon as possible as Ideas need to be considered objectively.
Slide 7: This slide presents Understand your customer. You can use it as per your requirement.
Slide 8: This slide showcases external sources of new product idea- Learning From, Competitors, Market Research, Long Range Studies, Market Gap Analysis, Consumer Activity Analysis, Some possible sources of data has been listed out to give you a fair idea, and it can be altered as per your requirement
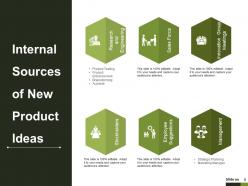
Slide 9: This slide presents Internal Sources of New Product Ideas with these parameters.
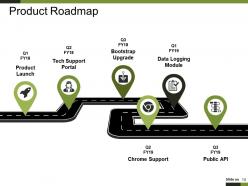
Slide 10: This slide showcases Product Roadmap with these features- Chrome Support, Public API, Data Logging Module, Bootstrap Upgrade, Tech Support Portal, Product Launch.
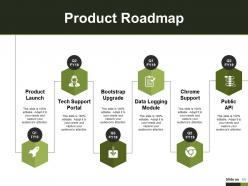
Slide 11: This slide presents Product Roadmap with these stages we have listed in this- Product Launch, Bootstrap Upgrade, Chrome Support, Tech Support Portal, Data Logging Module, Public API.
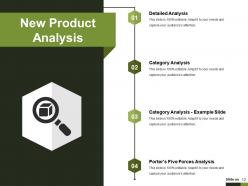
Slide 12: This slide showcases New Product Analysis with these four factors- Detailed Analysis, Category Analysis, Category Analysis - Example Slide, Porter’s Five Forces Analysis.
Slide 13: This slide shows Detailed Analysis with strengths and weakness you can add.
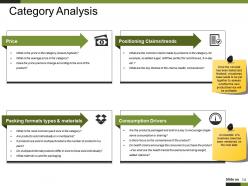
Slide 14: This slide showcases Category Analysis. An example of a business case has been mentioned on the next slide
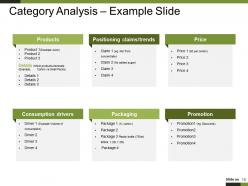
Slide 15: This slide presents Category Analysis – Example Slide. You can add in different parameters we have listed.
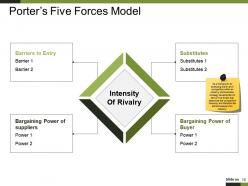
Slide 16: This slide presents posters five forces model. Its a framework for analyzing the level of competition within an industry and business strategy development to derive five forces that determine the competitive intensity and therefore the attractiveness of an industry
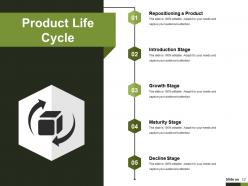
Slide 17: This slide showcases Product Life Cycle with these different stages- Repositioning a Product, Introduction Stage, Growth Stage, Maturity Stage, Decline Stage.
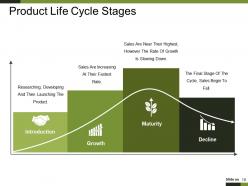
Slide 18: This slide presents Product Life Cycle Stages with these stages- Decline, Growth, Maturity, Introduction.
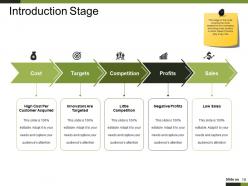
Slide 19: This slide showcases Introduction Stage which further showing detailed version of this- Low Sales, High Cost Per Customer Acquired, Negative Profits, Innovators Are Targeted, Little Competition, Cost, Targets, Competition, Profits, Sales, This stage of the cycle could be the most expensive for a company launching a new product in which these 5 factors play a key role
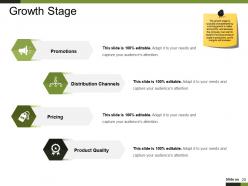
Slide 20: This slide presents Growth Stage with these four criterias showing- Promotions, Pricing, Distribution Channels, Product Quality, The growth stage is typically characterized by a strong growth in sales and profits, and because the company can start to benefit from economies of scale in production, profit margins will increase
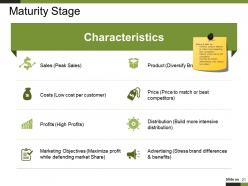
Slide 21: This slide showcases Maturity Stage. Promote the factors differentiating your product from others
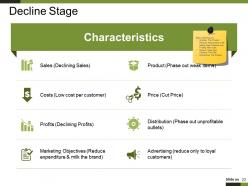
Slide 22: This slide shows Decline Stage with characteristics.
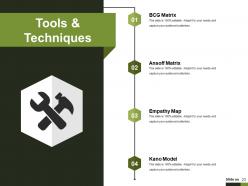
Slide 23: This slide presents Tools & Techniques with these four factors- BCG Matrix, Ansoff Matrix, Empathy Map, Kano Model.
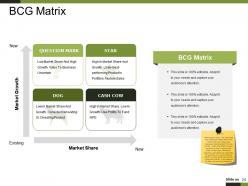
Slide 24: This slide presents BCG Matrix. There are two axes. The horizontal axis measures market share from low to high; the vertical axis measures market growth from low to high. Apply this criteria to each product you sell in order to plot them on the chart. Wherever possible use market and sales data; for example, you could compare growth in sales against the growth in the total market. In the absence of data, use your best judgment
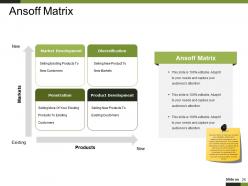
Slide 25: This slide showcases Ansoff Matrix . Use the matrix to help you consider your strategic options and determine the necessity for new product development. For example, your market analysis may conclude that there is plenty of opportunity for selling your current range of products to your current range of customers by penetrating the market with promotional strategies, such as multi-buy offers, to build loyalty
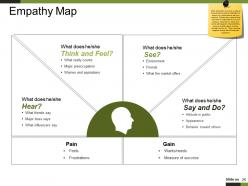
Slide 26: This slide presents Empathy Map. First, brainstorm to come up with all the possible customer segments to whom you might want to sell your product. Choose the customer that you think is most likely to buy your product. Give them a name and some demographic characteristics, such as marital status, income, children and so on. Then, using the diagram answer the following six questions:
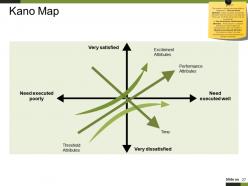
Slide 27: This slide showcases Kano Map.The model is divided into three distinct categories:1. Must be (basic) attributes. These are taken for granted attributes that the product must have and if they are unfulfilled consumers may be dissatisfied, One dimensional (performance) attributes. These result in customer satisfaction when fulfilled and dissatisfaction when not fulfilled Attractive (excitement) attributes. Their absence does not cause dissatisfaction but their presence can delight customers
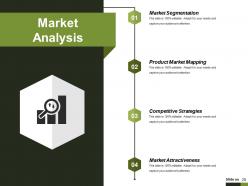
Slide 28: This slide presents Market Analysis with these four factors- Market Segmentation, Product Market Mapping, Competitive Strategies, Market Attractiveness.
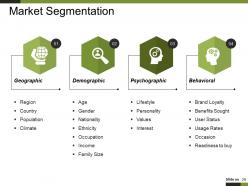
Slide 29: This slide showcases Market Segmentation with those four factors we have mentioned.
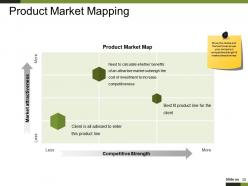
Slide 30: This slide showcases Product Market Mapping
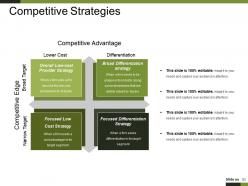
Slide 31: This slide shows Competitive Strategies with some of the factors we have made.
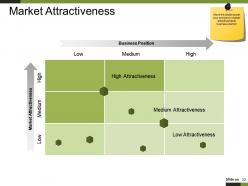
Slide 32: This slide presents Market Attractiveness. You can add the data and make use of it.
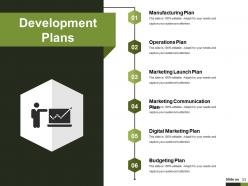
Slide 33: This slide shows Development Plans with these six stages- Manufacturing Plan, Operations Plan, Marketing Launch Plan, Marketing Communication Plan, Digital Marketing Plan, Budgeting Plan.
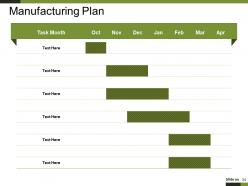
Slide 34: This slide presents Manufacturing Plan for the task with month..
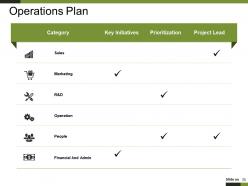
Slide 35: This slide shows Operations Plan with a table.
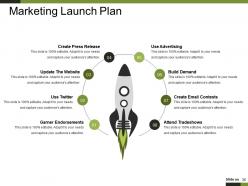
Slide 36: This slide showcases Marketing Launch Plan with these eight stages- Use Advertising, Build Demand, Create Email Contests, Attend Tradeshows, Create Press Release, Update The Website, Use Twitter, Garner Endorsements.
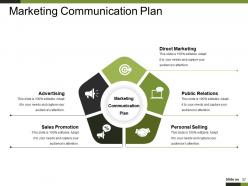
Slide 37: This slide presents Marketing Communication Plan with these five factors we have listed- Public Relations Personal Selling Advertising Sales Promotion Direct Marketing
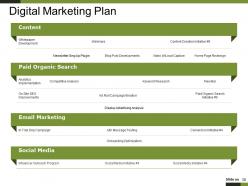
Slide 38: This slide showcases Digital Marketing Plan table.
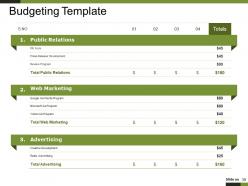
Slide 39: This slide presents Budgeting Template with some of the factors.
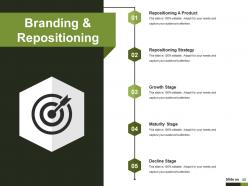
Slide 40: This slide showcases Branding & Repositioning with these five points- Repositioning A Product, Repositioning Strategy, Growth Stage, Maturity Stage, Decline Stage.
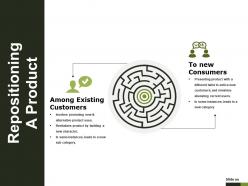
Slide 41: This slide presents Repositioning A Product with these two factors- Among Existing Customers, To new Consumers.
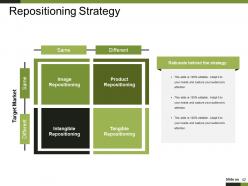
Slide 42: This slide showcases Repositioning Strategy with a matrix and use it as such.
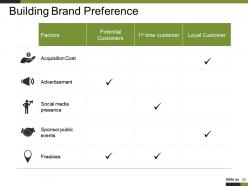
Slide 43: This slide shows Building Brand Preference with a table and make it useable.
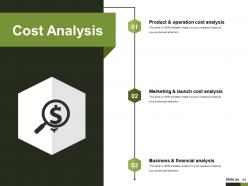
Slide 44: This slide presents Product & operation cost analysis with three of the characteristics- Marketing & launch cost analysis, Business & financial analysis, Cost Analysis.
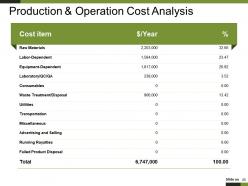
Slide 45: This slide showcases Production & Operation Cost Analysis table.
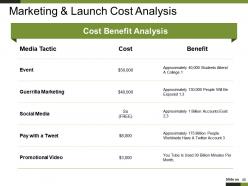
Slide 46: This slide presents Marketing & Launch Cost Analysis.
Slide 47: This slide showcases Business & Financial Analysis table and make it as per your requirement.
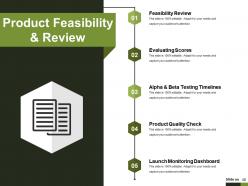
Slide 48: This slide shows Product Feasibility & Review with these five possibilities- Feasibility Review, Evaluating Scores, Alpha & Beta Testing Timelines, Product Quality Check, Launch Monitoring Dashboard.
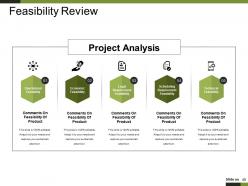
Slide 49: This slide presents Feasibility Review which further shows Project Analysis with these stages- Comments On Feasibility Of Product, Comments On Feasibility Of Product, Comments On Feasibility Of Product, Comments On Feasibility Of Product, Comments On Feasibility Of Product.
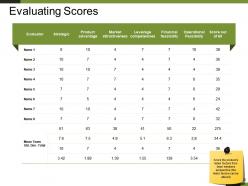
Slide 50: This slide presents Evaluating Scores. Score the product’s listed factors from team members perspective (the listed factors can be altered)
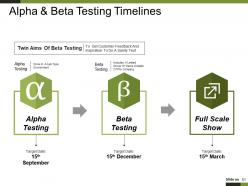
Slide 51: This slide showcases Alpha & Beta Testing Timelines.
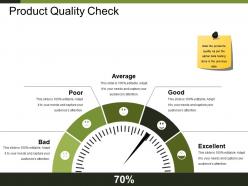
Slide 52: This slide presents Product Quality Check. Rate the product’s quality as per the alpha/ beta testing done in the previous slide.
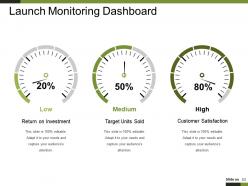
Slide 53: This slide showcases Launch Monitoring Dashboard. You can add the data and use it.
Slide 54: This slide shows Icons for NDP.
Slide 55: This slide is titled Additional Slides.
Slide 56: This slide represents Our Mission. State your mission, goals etc.
Slide 57: This slide showcases Our Team with Name and Designation to fill.
Slide 58: This slide helps show- About Our Company. The sub headings include- Creative Design, Customer Care, Expand Company .
Slide 59: This slide shows Our Goals for your company.
Slide 60: This slide shows Comparison of number of users and Time.
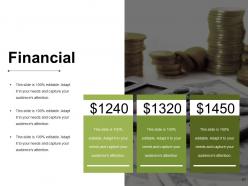
Slide 61: This slide is titled as Financials. Show finance related stuff here. de is 100% editable. Adapt it to your needs and capture your audience's attention.
Slide 62: This is a Quotes slide to highlight, or state anything specific. ntative image, and should be replaced by your own image. Just right click and replace image.
Slide 63: This slide shows Project Events Timeline with icons and text boxes.
Slide 64: Chart & Graphs 64
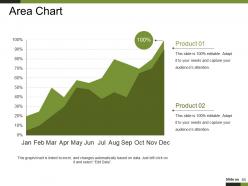
Slide 65: This slide showcases with area chart. You can add and compare the products.
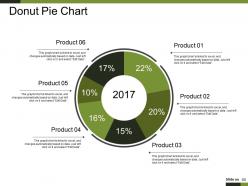
Slide 66: This slide presents Donut Pie Chart. You can compare the four product comparison.
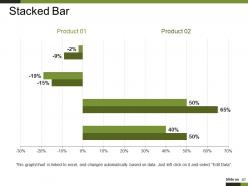
Slide 67: This slide shows a Stacked Line graph in terms of percentage and years for comparison of Product 01, Product 02, Product 03 etc.
Slide 68: This is a Thank You slide with Address:# street number, city, state, Contact Numbers and Email Address.
Product Lifecycle And Market Analysis Powerpoint Presentation Slides with all 68 slides:
Be fleet footed with our Product Lifecycle And Market Analysis Powerpoint Presentation Slides. Your brain will be alert and agile.
















FAQs for Product Lifecycle And Market Analysis
The product lifecycle includes introduction, growth, maturity, and decline stages, each requiring distinct marketing approaches for market penetration, competitive positioning, and brand sustainability. During introduction, companies focus on awareness-building and education, while growth emphasizes market expansion and differentiation, with mature products leveraging optimization strategies and declining products requiring strategic repositioning, ultimately enabling businesses to maximize revenue potential across each phase.
Businesses can effectively identify their product's lifecycle stage by analyzing sales growth patterns, market share trends, competitive landscape intensity, customer acquisition costs, and profit margin trajectories. Through comprehensive market research and performance metrics evaluation, companies can recognize whether they're in introduction, growth, maturity, or decline phases, ultimately enabling strategic resource allocation and informed decision-making for sustained competitive advantage.
Product lifecycle performance metrics include customer acquisition cost, market share, and revenue growth during introduction, sales velocity and customer satisfaction during growth, profitability margins and market penetration during maturity, and inventory turnover during decline. These metrics enable organizations to optimize resource allocation, adjust pricing strategies, and make strategic decisions about product enhancement or discontinuation, ultimately delivering competitive advantage and maximized returns across diverse industries.
Consumer behaviors shift dramatically across lifecycle stages, with early adopters driving introduction phase trial, mainstream markets fueling growth expansion, price-conscious comparisons dominating maturity, and loyal segments sustaining decline phases. These behavioral patterns enable companies to tailor marketing strategies, adjust pricing models, and optimize resource allocation, with many organizations finding that understanding these shifts delivers competitive advantage and enhanced customer retention.
Innovation serves as the primary catalyst for extending product lifecycles through redesign, feature enhancement, market repositioning, technology integration, and strategic pivoting. Companies like Apple with iPhone iterations, automotive manufacturers with hybrid transitions, and software firms with cloud migrations demonstrate how continuous innovation revitalizes mature products, ultimately delivering sustained competitive advantage and market relevance.
Companies can pivot during decline phase by diversifying into new markets, repositioning products for niche segments, implementing cost-reduction strategies, or discontinuing underperforming lines while reallocating resources. Through strategic market analysis and portfolio optimization, organizations streamline operations, minimize losses, and redirect investments toward emerging opportunities, ultimately maintaining competitive advantage while transitioning resources to higher-growth initiatives.
Product lifecycle management significantly impacts inventory and supply chain logistics through demand forecasting accuracy, procurement optimization, warehouse efficiency, and distribution planning coordination. Through strategic lifecycle analysis, manufacturers streamline inventory levels, reduce carrying costs, and minimize stockouts, while retailers enhance supply chain responsiveness and operational efficiency, ultimately delivering improved customer satisfaction and competitive advantage in increasingly dynamic markets.
External factors significantly influence product lifecycle stages by accelerating or extending each phase through competitive pressure, technological disruption, and shifting consumer preferences. Market trends like sustainability demands can revive declining products, while intense competition shortens growth phases, with many companies finding that proactive market monitoring and agile product adaptation ultimately deliver competitive advantage and extended market relevance.
Effective revitalization strategies include product redesign and feature enhancement, market repositioning and targeting new demographics, pricing adjustments and promotional campaigns, distribution channel expansion, and strategic partnerships or collaborations. These approaches work by refreshing customer perception, accessing untapped markets, and creating renewed value propositions, with many companies finding that combining multiple strategies delivers sustained competitive advantage and extended profitability.
Cultural variations significantly influence product lifecycle stages through differing consumer preferences, adoption rates, regulatory environments, and market maturity levels across regions. While technology products may rapidly penetrate urban Asian markets, they often require extended introduction phases in traditional societies, with companies like McDonald's and Coca-Cola adapting flavors, marketing approaches, and pricing strategies to match local cultural values, ultimately enabling successful global scaling through region-specific lifecycle management.
The product lifecycle offers strategic planning advantages through clear development stages, predictable resource allocation, market timing insights, and competitive positioning guidance. While this framework helps businesses anticipate challenges and optimize investments across introduction through decline phases, it can oversimplify complex market dynamics, with many organizations finding that combining lifecycle insights with real-time market data delivers more adaptive strategic outcomes.
Digital marketing strategies align with product lifecycle stages through targeted approaches: introduction phase emphasizes awareness campaigns and influencer partnerships, growth stage focuses on SEO optimization and social media expansion, maturity leverages customer retention programs and competitive differentiation, while decline phase utilizes remarketing and inventory clearance tactics. This strategic alignment enables companies to maximize marketing ROI at each stage, with many organizations finding that lifecycle-specific campaigns deliver significantly higher conversion rates and customer engagement than generic approaches.
Successful products demonstrate strategic reinvention through continuous innovation, market expansion, and customer feedback integration at each lifecycle stage. Companies like Apple with iPhones and Coca-Cola with brand extensions showcase how strategic pivots, feature enhancements, and market diversification enable sustained growth, with many organizations finding that proactive adaptation rather than reactive changes ultimately delivers competitive advantage and market longevity.
Seasonal products require concentrated lifecycle management with rapid scaling during peak periods, intensive inventory planning, and strategic markdown cycles, while evergreen products maintain steady demand patterns with gradual optimization phases. Retailers like fashion brands must accelerate development timelines and maximize short selling windows, whereas technology companies manage continuous improvement cycles, ultimately delivering different resource allocation strategies and inventory approaches.
Customer feedback drives strategic product modifications through market research, user testing, feature requests, performance analytics, and satisfaction surveys. This input enables companies to enhance functionality during growth phases, pivot features in maturity stages, and extend product lifecycles, with many organizations finding that systematic feedback integration reduces development costs while significantly improving market positioning and customer retention rates.
-
Helpful product design for delivering presentation.
-
Attractive design and informative presentation.