

Product manufacturing dashboards it transformation at workplace ppt rules





Try Before you Buy Download Free Sample Product
 Impress Your
Audience
 100%
Editable
 Save Hours
of Time


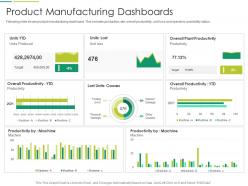
Following slide shows product manufacturing dashboard. This includes production rate, overall productivity, unit loss and operators availability status.
People who downloaded this PowerPoint presentation also viewed the following :
Product manufacturing dashboards it transformation at workplace ppt rules with all 2 slides:
Use our Product Manufacturing Dashboards IT Transformation At Workplace Ppt Rules to effectively help you save your valuable time. They are readymade to fit into any presentation structure.

FAQs for Product manufacturing dashboards it transformation at
Honestly, I'd start with just 6-8 metrics max or you'll overwhelm everyone. Focus on production stuff first - units produced, cycle times, how fast things are moving through. Quality's huge too: defect rates, first-pass yield, scrap percentage (that one always hurts the wallet). Then track your equipment performance like OEE and downtime - broken machines = no money. Don't forget cost tracking either - labor, materials, cost per unit. Oh, and safety incidents because nobody needs that drama. Pick whatever's giving you the biggest headaches right now. You can always add more later once people actually start checking the dashboard regularly instead of ignoring it.
Honestly, real-time dashboards are a game changer - you catch problems as they're happening instead of finding out about them way too late. Track your machine performance, production rates, quality stuff all in one spot. Set up alerts for when things go sideways so your team gets pinged immediately. That way you're fixing equipment issues before they tank your whole day. Plus handovers between shifts are way smoother when everyone's looking at live data. Oh, and decision-making gets faster too. Just pick your top 3-5 metrics that actually matter - don't go crazy tracking everything under the sun.
So predictive analytics is like having a crystal ball for your factory. You feed it historical data and it tells you when machines might break down, when demand's gonna spike, or if quality issues are brewing. Way better than scrambling when stuff goes wrong. It'll help you schedule maintenance before things actually fail and optimize production based on what it thinks demand will look like. The tricky part though? Making sure your dashboard doesn't just spit out confusing charts - you need clear alerts that actually tell you what to do next.
Dude, manufacturing dashboards are game-changers - you get real-time data instead of waiting around for those useless weekly reports. Machine performance, quality issues, production slowdowns... you'll catch problems while they're still small and fixable. It's honestly like having superpowers on the factory floor. Which lines are struggling? When do machines need maintenance? You'll know immediately. Oh, and don't go crazy with metrics at first - pick maybe 3 or 4 that actually matter. I've seen too many people drown themselves in data they never look at twice.
Stick to the 5-second rule - operators need to get the critical stuff immediately when they glance at the screen. Put your biggest KPIs right at the top, use the classic red/yellow/green for status (works every time), and don't cram everything on there. Seriously, I've walked past some dashboards that look like NASA mission control! Start with the big picture view but keep drill-downs ready. Match your refresh rates to how fast things actually move on the floor. Here's the key though - test it with real workers first. They'll tell you if you've built something that looks nice but totally misses the point.
Honestly, dashboards are great for catching bottlenecks because they show you everything in real-time - throughput, queue times, machine usage, all that stuff. Like when Station 3 is crawling at 40% while everything else is hitting 90%, it's super obvious something's wrong. Set up alerts so you're not glued to the screen all day (learned that one the hard way). The visual charts make patterns jump out at you way faster than spreadsheets ever could. Just make sure you're tracking the right metrics and organize views by production stage. That way you can actually drill down and fix whatever's broken instead of just staring at pretty graphs.
OPC-UA is your best bet for connecting to factory equipment - it's pretty much the industry standard. Pull data from ERP and quality systems using REST APIs. MQTT handles real-time sensor feeds really well, though honestly the setup can be a bit finicky at first. Apache Kafka or Azure IoT Hub work great for tying everything together. I'd start by figuring out what data sources you're actually working with. Then just pick whatever tech stack covers most of your needs without making things unnecessarily complicated. Don't overthink it.
Honestly, dashboards are game-changers for this stuff. Everyone gets the same real-time data instead of playing that awful telephone game with outdated reports. Your production folks can actually see quality metrics while quality teams check production schedules - suddenly nobody's working in the dark anymore. No more "my numbers are different" fights either, which is honestly such a relief. You can create shared views showing how departments affect each other, like when maintenance messes with production targets. Figure out what metrics each team needs from the others first though. That's where the magic happens.
Set up dashboards for the stuff that actually matters - delivery times, how your suppliers are doing, inventory, quality scores. It's like having a control room for everything. I'd focus on on-time delivery rates and lead times first, plus any bottlenecks. The alerts are honestly a lifesaver when suppliers flake or you're running low on stock. Start with your biggest 3-5 headaches and build widgets for those. There's something weirdly satisfying about seeing all green indicators, though that rarely happens in real life.
Don't cram everything onto one screen - that's the worst thing you can do. I've literally seen dashboards with like 25 metrics that nobody even looks at anymore. Focus on what your operators actually need, not fancy numbers that just look good in meetings. Real-time stuff matters most - machine downtime, quality alerts, things people can act on right away. Test it with actual users first (trust me on this one). Start small with maybe 5-7 key things. For each metric, ask yourself "okay, but what would someone DO with this info?" If there's no good answer, cut it.
So basically you want to show different people different stuff on their dashboards. Operations folks need the real-time production numbers and alerts when things break down. Executives just want the big picture KPIs and trends - they don't care about the nitty-gritty. Quality teams are all about defect rates and compliance (obviously), while maintenance guys need to see equipment health. Here's the thing though - you're using the same data for everyone, just filtering it differently. Nobody wants to dig through a bunch of irrelevant metrics when they're in a hurry. Set up permissions so people automatically see their dashboard when they log in. Makes life way easier.
Dude, real-time data changes everything. Instead of staring at yesterday's numbers, you're watching actual performance as it happens. Manual entry errors? Gone. Those instant alerts when something goes sideways are honestly pretty satisfying to get. Your dashboards stop being just reports and start helping you catch bottlenecks before they wreck your day. The granular insights into quality issues are wild too - way more detail than I expected when we first set ours up. Focus on automating your biggest production metrics first. Decision-making gets so much faster it's ridiculous.
Dude, you gotta start collecting data on everything - even stuff that seems pointless right now. Once you've got months of production history, your dashboards become crazy useful for spotting patterns and predicting failures before they happen. Way better than just scrambling when things break. The trick is keeping your data clean and consistent, otherwise you're just looking at garbage. I learned this the hard way when our tracking system was a mess for like six months. Short version: historical data turns you from reactive to proactive. Game changer.
So the big thing right now is real-time data mixed with AI that actually predicts failures before they happen. Mobile design is everywhere since nobody wants to be stuck at a desk - plant managers are checking KPIs while walking around. Oh, and customizable dashboards are getting really good at filtering out the noise so teams only see what matters to them. Honestly, the platforms worth your money are ones that play nice with whatever IoT sensors you've already got installed and can give you those "heads up, this is gonna break" alerts.
Start with your cleanest data sources - pull from ERP, MES, quality systems, that stuff. Manual entry is where everything goes to hell, so avoid it. Set up validation rules that catch errors before they mess up your dashboard. You'll want regular audits too, and honestly, assign clear ownership because nobody cares about orphaned data streams. Real-time alerts help when numbers get wonky or fall outside normal ranges. Here's the thing though - your operators are gold for catching weird stuff since they actually know what's supposed to look normal on the floor. Build in a way for them to flag issues.
-
Qualitative and comprehensive slides.
-
Colors used are bright and distinctive.
-
Great designs, Easily Editable.
-
Helpful product design for delivering presentation.
-
Informative design.