

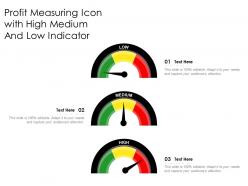
Profit measuring icon with high medium and low indicator





Try Before you Buy Download Free Sample Product
 Impress Your
Audience
 100%
Editable
 Save Hours
of Time


Our Profit Measuring Icon With High Medium And Low Indicator are topically designed to provide an attractive backdrop to any subject. Use them to look like a presentation pro.
People who downloaded this PowerPoint presentation also viewed the following :
Profit measuring icon with high medium and low indicator with all 2 slides:
Use our Profit Measuring Icon With High Medium And Low Indicator to effectively help you save your valuable time. They are readymade to fit into any presentation structure.

FAQs for Profit measuring icon with high medium
Key profit measurement indicators include gross profit margin, net profit margin, operating profit margin, return on investment (ROI), and earnings before interest and taxes (EBITDA). These metrics enable businesses to assess financial health, operational efficiency, and competitive positioning across different timeframes, with many organizations finding that consistent tracking ultimately delivers better resource allocation and strategic decision-making capabilities.
Gross profit margin measures profitability after direct costs while net profit margin reflects overall profitability after all expenses, including operating costs, taxes, and interest. While gross margin reveals operational efficiency in production or service delivery, net margin provides comprehensive insight into management effectiveness and cost control, with investors increasingly using both metrics together to assess financial sustainability, competitive positioning, and long-term viability across diverse market conditions.
EBITDA provides clearer operational insights by eliminating the effects of financing decisions, tax strategies, and accounting depreciation methods that can obscure core business performance. Unlike net income, which includes these variables, EBITDA enables investors and managers to compare operational efficiency across companies and industries more effectively, with many financial analysts finding that it reveals the true cash-generating potential of business operations.
Return on equity (ROE) helps businesses evaluate investment effectiveness by measuring how efficiently shareholder investments generate profits, comparing returns across different projects, and benchmarking performance against industry standards. Through ROE analysis, companies can identify high-performing divisions, optimize capital allocation strategies, and demonstrate value creation to investors, with many financial institutions and manufacturing firms finding that consistent ROE improvement signals sustainable competitive advantage.
Return on assets (ROA) serves as a critical efficiency metric by measuring how effectively a company converts its total assets into profit, revealing management's ability to generate returns from available resources. This indicator enables investors, analysts, and executives to compare operational performance across different industries and company sizes, with many organizations finding that consistent ROA improvement signals strong strategic execution, optimized resource allocation, and sustainable competitive positioning in increasingly demanding markets.
Cash flow indicators, particularly free cash flow, reveal profit sustainability by showing actual cash generated after capital expenditures, debt obligations, and operational expenses. Unlike accounting profits, free cash flow demonstrates real liquidity available for growth investments, dividend payments, and strategic initiatives, with many financial analysts finding that consistent positive free cash flow indicates genuinely sustainable profitability.
Industry benchmarks provide essential context for interpreting profit measurement indicators by establishing comparative standards, identifying performance gaps, revealing competitive positioning, and highlighting improvement opportunities across similar companies. Through benchmark analysis, organizations can assess whether their profit margins, ROI, and efficiency ratios are competitive within their sector, ultimately enabling strategic adjustments and enhanced financial performance.
Fixed and variable costs significantly influence profit margins through their distinct behavioral patterns, with variable costs fluctuating directly with production volume while fixed costs remain constant regardless of output levels. Manufacturing sectors typically maintain higher fixed costs through equipment and facilities, while service industries often experience greater variable cost sensitivity, ultimately requiring strategic cost structure optimization to enhance profitability and competitive positioning.
Profit measurement indicators present challenges including short-term focus that may overlook long-term strategic investments, potential manipulation through accounting practices, and inability to capture non-financial factors like customer satisfaction or employee engagement. While these metrics deliver essential financial insights, organizations increasingly find that combining profit indicators with balanced scorecards and operational metrics enables more comprehensive decision-making, ultimately delivering sustainable competitive advantage.
Businesses can use gross profit margin to optimize pricing by analyzing product-level profitability, identifying underperforming items, and adjusting prices based on cost structures and market positioning. Through margin analysis, companies in retail and manufacturing can strategically increase prices on high-demand products, bundle low-margin items with profitable ones, and eliminate unprofitable offerings, ultimately enhancing overall profitability.
**INPUT**: What should businesses consider when analyzing year-over-year profit growth? **OUTPUT**: Businesses should consider revenue composition changes, cost structure shifts, market conditions, seasonal variations, and one-time events when analyzing year-over-year profit growth. These factors enable organizations to distinguish between sustainable growth trends and temporary fluctuations, with many companies finding that comprehensive analysis ultimately delivers more accurate strategic planning and competitive positioning. [Word count: 54 words]
Profit measurement indicators differ as service-based industries emphasize billable hours, utilization rates, client retention, and project margins, while product-based industries focus on gross margins, inventory turnover, cost of goods sold, and unit profitability. Through these specialized metrics, service companies optimize resource allocation and client relationships, whereas product companies streamline manufacturing efficiency and supply chain costs, ultimately delivering competitive advantage in their respective markets.
Operating income reveals a company's core business profitability by excluding non-operational factors like interest, taxes, and one-time expenses, providing investors and managers with clear insight into operational efficiency. This metric enables stakeholders to assess sustainable earning power, compare performance across competitors, and make strategic decisions about resource allocation, with many financial analysts finding that consistent operating income growth indicates strong business fundamentals and competitive positioning.
Advanced analytics enhances profit measurement accuracy by leveraging real-time data processing, predictive modeling, machine learning algorithms, and automated variance analysis to eliminate manual errors and capture granular cost drivers. Through sophisticated forecasting tools, organizations streamline financial reporting, identify hidden profit levers, and deliver more precise margin calculations, with many financial services and retail companies finding significantly improved decision-making capabilities.
Emerging trends in profit measurement indicators include customer lifetime value metrics, subscription revenue tracking, digital engagement profitability, data monetization assessments, and platform ecosystem valuations. These indicators help organizations measure intangible asset performance, recurring revenue streams, and network effects, with many digital companies finding that traditional profit metrics inadequately capture their strategic value creation.
No Reviews