

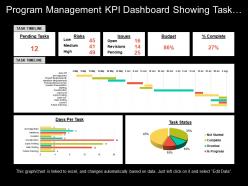
Program management kpi dashboard showing task timeline risks and budget





Try Before you Buy Download Free Sample Product
 Impress Your
Audience
 100%
Editable
 Save Hours
of Time


Graphical Program Management Dashboard PowerPoint template is a very useful tool in explaining the different fundamental concepts such as Pending Task, Risks, Issues, Budget, and Complete Percentage. The project manager has to see lots of task timeline charts on a week to week basis and they are easy to read so he can take help of Task Timeline Dashboard Slide. This graphical representation PPT slide helps in illustrating the key points of a project in a most effective way. The different fundamental charts such as Time charts that can represent values over time and other one is Category charts that can represent the value distribution across several categories. A user can incorporate both these types of the chart in his presentation to make it look more appealing. The Graphical Chart KPI template to present the target or budget of a specific task. Program Management slide is consistent as well as a powerful way to report your dashboard, but you need to adjust the information, design, and layout of your slide which suit your information. Inserting numerical information is easy as you can enter the information by using Excel Sheet. Find the future direction to follow. Our Program Management Kpi Dashboard Showing Task Timeline Risks And Budget help analyse the different avenues.
People who downloaded this PowerPoint presentation also viewed the following :
Program management kpi dashboard showing task timeline risks and budget with all 6 slides:
Inject folks with a dose of happiness with our Program Management Kpi Dashboard Showing Task Timeline Risks And Budget. Be able to distribute joy.


FAQs for Program management kpi dashboard showing task timeline
Track the basics first - are you hitting milestones and staying on budget? Those matter most. Scope completion percentage and stakeholder satisfaction scores are solid too. Quality stuff like defect rates? Yeah, definitely include those. But honestly, I've watched way too many PMs obsess over metrics that look fancy but tell you nothing about whether you're actually winning. Pick 4-5 that directly connect to your main goals. Don't go crazy with like 20 different dashboards - you'll just confuse yourself. Once you've got those down and your data's reliable, then maybe add more.
Honestly, quarterly surveys work best - I learned the hard way that monthly ones just annoy people. Use a simple 1-5 scale for stuff like communication and delivery quality. Break it down by stakeholder type too since sponsors care about totally different things than end users. Don't get hung up on individual scores though. Trends matter way more. Always throw in some open-ended questions because numbers only tell half the story. Oh, and here's the thing everyone forgets - you actually have to DO something with the feedback and tell people what changed. Otherwise it's just pointless data collection.
So budget variance is basically your wake-up call - shows if you're overspending or under budget compared to what you planned. Track both the actual dollar amounts and percentages to see the full story. I swear, I've watched PMs brush off tiny variances thinking "it's fine" and then everything spirals later. When you keep hitting negative variance, that's screaming resource issues or scope creep. Set up some thresholds - maybe 5-10% - with alerts so you can fix things before they blow up. Better to catch it early than explain to your boss why you're 30% over, trust me.
Honestly, I'd focus on both speed and quality stuff. Story points per sprint is solid, plus cycle time from kickoff to delivery. Defect rates matter too - though velocity gets weird if teams size things differently (learned that the hard way). Stakeholder satisfaction scores are clutch, and definitely track if you're actually hitting your milestone dates. Mix the "what got done" metrics with "did this actually matter" ones. Start with maybe 3-4 metrics that match what you're trying to achieve. You can always pile on more once you've got the basics down.
Track defect rates and customer satisfaction first - those tell you the most. First-pass yield is solid too (basically how often stuff gets accepted without changes). Time-to-resolution matters but honestly, stakeholder acceptance rates give you the real story about what clients actually think. Rework percentages are annoying to calculate but super telling. I'd skip defect density for now since it's inconsistent across different projects anyway. Post-delivery feedback scores round it out nicely. Don't try measuring everything though - pick 2-3 and actually use them.
Honestly, just work backwards from what your executives actually care about. If they want 20% revenue growth, your KPIs need to tie directly to revenue drivers - not just stuff that's easy to measure. We've all fallen into that trap with vanity metrics that look good but don't move the needle. The real test? You should be able to explain why improving your KPI will impact those big strategic goals. Like, draw me a straight line from your program to business results. That way when someone inevitably asks "okay but so what?" you'll have a solid answer ready.
Here's what I'd do - start tracking your NPS and customer satisfaction scores as actual KPIs, not just side metrics. Customer health scores are honestly game-changers for seeing relationship quality at a glance. Also measure how fast you're resolving support tickets and whether people are actually using the features you build. I always track response times too because customers notice when you're slow to act on their feedback. Oh, and monitor how quickly you roll out their suggestions - that shows you're listening. The whole point is making customer voice count toward your program's success, not treating it like an afterthought.
Honestly, start with utilization rates - that's the easiest data to pull from whatever project tool you're using. Track how much time your people spend on actual billable work vs sitting around. Cost per deliverable is huge too, plus budget variance (basically are you bleeding money lol). The planned vs actual hours thing is my favorite even though it hurts to look at sometimes. Also keep an eye on how often you're yanking people off projects or scrambling for resources at the last second. That scrambling is usually a dead giveaway that something's broken in your allocation process.
Honestly, I'd focus on two main things - when your milestones actually finish vs when they're supposed to, plus your overall schedule variance percentage. Weekly check-ins work way better than monthly reports, btw. Set up some kind of dashboard that screams at you when stuff's running 5-10% behind. Critical path items need their own tracking since they mess with your end date directly. I always watch recovery time too - like how fast you bounce back when things go sideways. That tells you if your process actually works under pressure. Start small with your top 3-5 milestones and expand once you get the hang of it.
Risk metrics are like your program's smoke detector - they catch problems before everything goes up in flames. Track stuff like how fast new risks show up, whether your fixes actually work, and where you're most exposed. Most PMs (including me honestly) learn this the hard way after getting burned. You'll start noticing patterns too - like which teams always seem to create drama or if that "quick fix" you tried last month was total BS. Just build these checks into your regular reviews so you're not constantly playing whack-a-mole with disasters.
Start with dependency health score - how many cross-project dependencies are actually on track vs completely screwed. Lead time matters too (how long other teams take to deliver your stuff). Oh, and definitely track critical path dependencies that'll blow up your timeline. Requirements always change mid-flight, so dependency change frequency is worth watching. Communication lag between teams kills projects faster than anything else - measure how fast issues get escalated and actually resolved. Honestly though? Pick 2-3 that are causing you the most pain right now. You can always add more tracking later once you've got those figured out.
Track both your hard savings (actual cost cuts, revenue bumps) and soft benefits against what you spent on the program. Yeah, putting dollar amounts on "efficiency gains" is annoying but executives want numbers. Use this formula: (Total Benefits - Program Costs) / Program Costs × 100. Some benefits won't show up for months though, so pick your timeframe carefully. I'd set up quarterly check-ins to see how you're tracking against projections. Oh, and don't forget ongoing operational costs - they'll bite you later if you ignore them now.
Dude, ditch the old school metrics for Agile stuff. Velocity and sprint burndowns are way more useful than tracking budget variance or scope creep. Customer satisfaction scores matter way more than people think - like, actually ask if users are happy with what you're shipping. Cycle time shows you where things get stuck. I'd also watch team health metrics because miserable developers write terrible code (learned that the hard way). Oh, and track how often you're actually deploying per sprint. Don't throw out your current KPIs yet though - run both for a while so you can compare the insights you get.
Honestly, start with quarterly pulse surveys - ask about job satisfaction, workload, how supported they feel. The response rate alone tells you tons. Track your voluntary turnover and see who's moving up internally (or not). Even attendance at optional stuff matters - people skip team events when they're checked out. Set up dashboards so you're actually checking this regularly instead of scrambling when someone quits. Oh, and don't stress about perfect scores - it's all about watching trends over time. Exit interviews help too, though by then it's kinda too late.
Honestly, monthly is ideal but quarterly works too if you're swamped. Things change so fast that your KPIs from six months ago are probably useless now - learned that the hard way lol. Do a quick monthly sanity check, then go deeper every quarter and actually question if you're measuring the right stuff. Major milestone or scope change? Update immediately, don't wait. Oh and set a recurring calendar reminder or you'll totally forget like I always do.
-
The Designed Graphic are very professional and classic.
-
Presentation Design is very nice, good work with the content as well.