

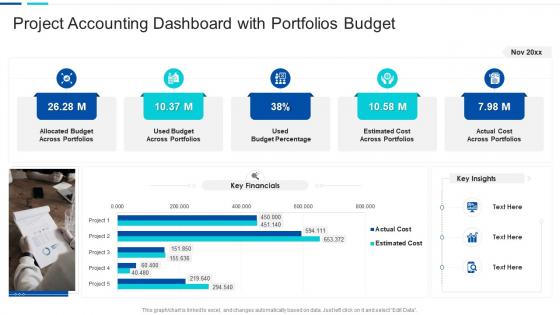
Project accounting dashboard with portfolios budget




Try Before you Buy Download Free Sample Product
 Impress Your
 Audience
 100%
100% Editable
 Save Hours
 of Time


Our Project Accounting Dashboard With Portfolios Budget are topically designed to provide an attractive backdrop to any subject. Use them to look like a presentation pro.
People who downloaded this PowerPoint presentation also viewed the following :
Project accounting dashboard with portfolios budget with all 10 slides:
Use our Project Accounting Dashboard With Portfolios Budget to effectively help you save your valuable time. They are readymade to fit into any presentation structure.









FAQs for Project accounting dashboard
Key components of an effective project accounting dashboard include budget tracking, cost allocation, revenue recognition, milestone progress, resource utilization, and variance analysis. These elements work together by providing real-time financial visibility, enabling proactive cost management, and streamlining project profitability analysis, with many organizations finding that integrated dashboards significantly enhance decision-making and project outcomes.
Project accounting dashboards enhance decision-making by providing real-time visibility into budget performance, resource allocation, cost variances, and profitability metrics in consolidated views. Through automated reporting and predictive analytics, project managers can identify potential overruns early, optimize resource deployment, and make data-driven adjustments, ultimately delivering improved project outcomes and enhanced operational efficiency.
Key metrics include budget variance, actual vs. planned costs, profit margins, cash flow tracking, resource utilization rates, and milestone-based revenue recognition. These financial indicators streamline project oversight by enabling real-time cost control, identifying budget deviations early, and optimizing resource allocation, with many organizations finding that comprehensive dashboards ultimately deliver improved profitability and enhanced project delivery timelines.
Real-time data integration eliminates manual data entry errors, reduces reporting delays, and ensures financial information reflects current project status across all connected systems. Through automated synchronization with ERP, time tracking, and expense management platforms, organizations achieve up-to-date budget tracking, accurate cost allocation, and immediate variance identification, ultimately delivering enhanced decision-making capabilities and improved project profitability.
Visualization transforms complex project financial data into intuitive charts, graphs, and heat maps that enable instant comprehension of budget variances, cost trends, and resource allocation patterns. Through visual elements like progress bars and color-coded alerts, project managers quickly identify financial risks, track milestone costs, and communicate budget status to stakeholders, ultimately delivering faster decision-making and enhanced project control.
Project accounting dashboards can be tailored through role-specific data visualization, customizable metrics displays, and hierarchical access controls that match each stakeholder's decision-making needs. Executives typically receive high-level profitability summaries and portfolio overviews, while project managers access detailed cost breakdowns and resource allocation data, and team members view task-specific budgets and milestone progress, ultimately enabling faster decision-making across organizational levels.
Common challenges include data integration from multiple systems, ensuring real-time accuracy, user adoption resistance, customization complexity, and establishing proper access controls. Organizations often find that inadequate training, inconsistent data formats, and lack of stakeholder buy-in can delay implementation, while successful deployments require strategic planning and comprehensive change management to deliver enhanced project visibility and financial control.
Project accounting dashboards should be updated in real-time or daily for active projects, with weekly updates sufficient for long-term initiatives and monthly reviews for portfolio-level tracking. The frequency depends on project complexity, stakeholder requirements, and decision-making needs, with many organizations finding that automated daily updates deliver optimal visibility while enabling timely budget adjustments and resource reallocation.
**INPUT**: What software tools are best suited for creating project accounting dashboards? **OUTPUT**: Leading project accounting dashboard tools include QuickBooks Project, Microsoft Project, Tableau, Power BI, and Smartsheet, each offering specialized financial tracking capabilities. These platforms streamline budget monitoring, expense tracking, and profitability analysis through real-time reporting and automated data integration, with many organizations finding that strategic dashboard implementation delivers enhanced project visibility and significantly improved financial control across multiple concurrent projects. **Word count: 60 words**
Historical data integration involves importing past financial records, establishing baseline metrics, creating comparative time periods, and implementing trend visualization tools across multiple reporting cycles. Through automated data connections and standardized categorization, organizations can identify spending patterns, budget variance trends, and performance benchmarks, ultimately enabling more accurate forecasting and strategic resource allocation for future projects.
Mobile-compatible project accounting dashboards enable real-time access to financial data, budget tracking, expense monitoring, milestone updates, and resource allocation from anywhere. These platforms streamline decision-making by delivering instant project insights, automated alerts, and collaborative features, with many project managers finding that mobile accessibility accelerates approvals, reduces delays, and ultimately enhances client responsiveness and operational efficiency.
Project accounting dashboards assist in resource allocation and budgeting by providing real-time visibility into project costs, resource utilization rates, and budget performance across multiple initiatives simultaneously. Through automated tracking and visual analytics, organizations can identify underutilized resources, reallocate personnel between projects, and adjust budgets proactively, ultimately delivering improved project profitability and strategic resource optimization.
**INPUT**: What strategies can be employed to ensure data integrity in project accounting dashboards? **OUTPUT**: Data integrity strategies include automated validation rules, real-time synchronization protocols, regular audit trails, standardized data entry processes, and role-based access controls. These approaches streamline accuracy by preventing duplicate entries, flagging anomalies, and maintaining consistent formatting, with many organizations finding that integrated validation systems ultimately deliver enhanced financial transparency and more reliable project cost tracking. [Word count: 57 words]
Predictive analytics integrates into project accounting dashboards through machine learning algorithms, historical data analysis, trend modeling, and real-time performance indicators. These technologies enable organizations to forecast budget overruns, resource needs, and timeline risks by analyzing patterns from previous projects, ultimately delivering more accurate financial planning and proactive decision-making capabilities.
Project accounting dashboard best practices include intuitive navigation, role-based access controls, real-time data integration, customizable widgets, and clear visual hierarchies that prioritize critical metrics. These design principles streamline financial oversight by reducing cognitive load, enabling faster decision-making, and ensuring stakeholders access relevant information efficiently, with many organizations finding that user-centric dashboards significantly enhance project profitability and accountability.
-
Appreciate the research and its presentable format.
-
Wonderful templates design to use in business meetings.
-
Designs have enough space to add content.