

Project Management Dashboard With Actual Cost




Try Before you Buy Download Free Sample Product
 Impress Your
 Audience
 100%
100% Editable
 Save Hours
 of Time


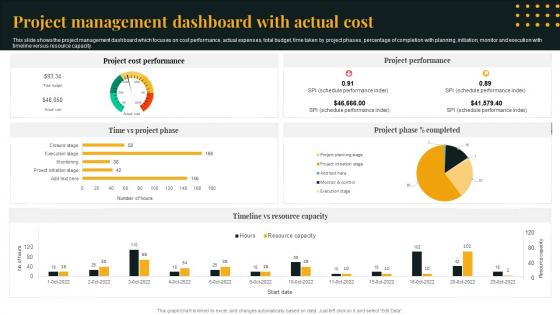
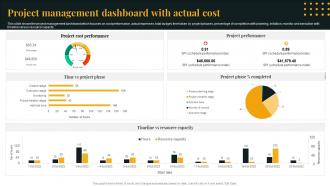
This slide shows the project management dashboard which focuses on cost performance, actual expenses, total budget, time taken by project phases, percentage of completion with planning, initiation, monitor and execution with timeline versus resource capacity.
People who downloaded this PowerPoint presentation also viewed the following :
Project Management Dashboard With Actual Cost with all 7 slides:
Use our Project Management Dashboard With Actual Cost to effectively help you save your valuable time. They are readymade to fit into any presentation structure.





FAQs for Project Management Dashboard
Key components of a project management dashboard include project timelines, budget tracking, resource allocation, milestone progress, and risk indicators. These elements work together by providing real-time visibility into project health, enabling faster decision-making, and streamlining communication across teams, with many organizations finding that comprehensive dashboards ultimately enhance project delivery and strategic alignment.
Visualizations enhance data interpretation by transforming complex project metrics into intuitive charts, graphs, and progress indicators that enable instant comprehension of project status, resource allocation, and timeline adherence. These visual elements streamline decision-making for project managers by highlighting bottlenecks, tracking milestone achievements, and displaying team performance trends, ultimately delivering faster project insights and more strategic resource management across organizations.
**INPUT**: What tools are best for creating an effective project management dashboard? **OUTPUT**: Effective project management dashboard tools include Microsoft Project, Asana, Trello, Tableau, and Monday.com, each offering unique visualization and tracking capabilities. These platforms streamline project oversight by centralizing task management, resource allocation, and progress monitoring, with many organizations finding that integrated dashboards ultimately deliver enhanced team collaboration and faster project completion rates. **Word count: 54 words**
A project management dashboard helps track progress and performance by providing real-time visibility into timelines, budgets, resource allocation, milestone completion, and team productivity through centralized data visualization. These platforms enable project managers to identify bottlenecks, optimize workflows, and make data-driven decisions, with many organizations finding that dashboard implementation reduces project delays by 30% while enhancing stakeholder communication and accountability.
A project management dashboard facilitates stakeholder communication by providing centralized visibility, real-time updates, standardized reporting formats, and automated notifications for milestone changes. Through shared access to project metrics, timeline visualizations, and progress indicators, stakeholders across departments can align expectations, reduce email exchanges, and make informed decisions collaboratively, ultimately streamlining coordination and enhancing project transparency.
**INPUT**: What metrics are most important to display in a project management dashboard? **OUTPUT**: Essential project management dashboard metrics include timeline adherence, budget utilization, resource allocation, milestone completion rates, and team productivity indicators. These metrics streamline decision-making by providing real-time visibility into project health, enabling proactive risk management, and facilitating strategic resource adjustments, with many organizations finding that comprehensive dashboards ultimately deliver improved project outcomes and enhanced stakeholder confidence. **Word Count**: 58 words
Project management dashboards support risk management by providing real-time visibility into potential issues, tracking risk indicators across multiple projects, and enabling proactive decision-making through centralized data analysis. These platforms streamline risk identification, assessment, and mitigation workflows, with many organizations finding that automated alerts and predictive analytics help teams address challenges before they impact project timelines, ultimately delivering better outcomes and reduced costs.
Strategic dashboards focus on high-level metrics like portfolio performance, resource allocation across initiatives, budget variance, and strategic goal alignment for executives. Operational dashboards track daily project activities, task completion rates, team productivity, milestone progress, and immediate bottlenecks for project managers, with organizations finding that this dual approach enables better decision-making at both leadership and execution levels.
Dashboards can be customized through configurable widgets, industry-specific KPI templates, role-based access controls, and flexible reporting modules tailored to project requirements. For instance, construction dashboards emphasize milestone tracking and resource allocation, while software development focuses on sprint progress and bug resolution, with many organizations finding that customized interfaces improve team adoption and decision-making efficiency.
Real-time data serves as the foundation for effective project management dashboards by providing instant visibility into project progress, resource allocation, budget status, and potential bottlenecks. This immediate access enables project managers to make informed decisions quickly, address issues before they escalate, and maintain stakeholder alignment, ultimately delivering improved project outcomes and enhanced operational efficiency across organizations.
User feedback influences dashboard design by identifying pain points, preferred workflows, and missing features that enhance daily project management tasks. Through iterative user testing and feedback collection, development teams can optimize interface layouts, streamline navigation, and add functionalities like customizable reporting or automated notifications, ultimately delivering more intuitive dashboards that improve team productivity and project visibility.
Best practices for maintaining project management dashboards include establishing regular update schedules, automating data feeds where possible, standardizing metrics across projects, conducting periodic stakeholder reviews, and ensuring mobile accessibility. These practices enhance operational efficiency by delivering real-time visibility, streamlining decision-making processes, and maintaining data accuracy, with many organizations finding that consistent dashboard maintenance ultimately accelerates project delivery and improves resource allocation.
A project management dashboard assists resource allocation by providing real-time visibility into team capacity, project demands, and skill availability across multiple initiatives simultaneously. Through centralized tracking and analytics, organizations can identify bottlenecks, redistribute workloads strategically, and optimize talent deployment, with many companies finding that dashboard-driven allocation reduces project delays while maximizing team productivity.
Teams face challenges including resistance to change, data integration complexities, user adoption hurdles, inadequate training, and selecting inappropriate dashboard features for their workflows. While these obstacles present initial implementation difficulties, organizations increasingly find that proper change management, comprehensive training programs, and phased rollouts enable teams to overcome resistance, ultimately delivering enhanced project visibility, streamlined collaboration, and improved decision-making capabilities.
Data accuracy in project management dashboards requires establishing automated data integration from source systems, implementing real-time validation rules, and conducting regular data audits across all connected platforms. Organizations enhance reliability by creating standardized data entry protocols, setting up automated alerts for anomalies, and maintaining clear data governance frameworks, with many finding that combining multiple verification methods ultimately delivers more trustworthy insights and better project decisions.
-
“Ample and amazing variety of templates available, really helpful for making professional PPT for day to day workings.”
-
SlideTeam is my one-stop destination for templates. Highly recommended!