


Project management metrics with performance report





Try Before you Buy Download Free Sample Product
 Impress Your
Audience
 100%
Editable
 Save Hours
of Time


Our Project Management Metrics With Performance Report are topically designed to provide an attractive backdrop to any subject. Use them to look like a presentation pro.
People who downloaded this PowerPoint presentation also viewed the following :
Content of this Powerpoint Presentation
Description:
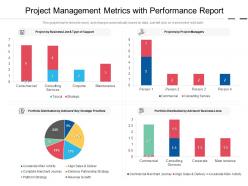
The image is a PowerPoint slide titled "Project Management Metrics with Performance Report." It includes four different charts to represent various metrics:
1. Project by Business Line & Type of Support:
A bar chart showing the number of projects categorized by business line (Commercial, Consulting Services, Corporate, Maintenance) and the type of support provided (Tactical, Strategic).
2. Projects by Project Managers:
Another bar chart displays the number of projects handled by individual project managers, with a distinction between Commercial and Consulting Services projects.
3. Portfolio Distribution by Advisors' Key Strategic Priorities:
A pie chart breaks down the portfolio by strategic priorities such as "Accelerate M&A Activity," "Align Sales & Deliver," "Complete Merchant Journey," etc., with percentages for each category.
4. Portfolio Distribution by Advisors’ Business Lines:
This bar chart shows the number of projects within each business line, with the focus on different strategic initiatives like "Commercial Merchant Journey," "Align Sales & Delivery," and
5. Accelerate M&A Activity.
Each chart is color-coded for clarity and the slide notes that the graphs/charts are linked to Excel and can be updated by editing the data.
Use Cases:
The slide can be utilized in numerous industries for performance reporting and strategic planning purposes:
1. Financial Services:
Use: Tracking project distribution and strategic priorities in financial portfolios.
Presenter: Financial Analyst
Audience: Investment team, stakeholders
2. Marketing and Advertising:
Use: Evaluating campaign distribution by business line and strategic focus.
Presenter: Marketing Manager
Audience: Marketing team, corporate clients
3. Technology:
Use: Monitoring project allocation across product lines and strategic initiatives.
Presenter: Technology Officer
Audience: Development team, investors
4. Retail Management:
Use: Assessing project distribution in commercial strategies and consulting services.
Presenter: Retail Strategist
Audience: Retail management, business consultants
5. Real Estate:
Use: Analyzing project distribution by real estate business lines and market strategies.
Presenter: Real Estate Analyst
Audience: Real estate agents, investors
6. Healthcare:
Use: Managing project distribution by strategic priorities in healthcare services.
Presenter: Healthcare Administrator
Audience: Medical staff, department heads
7. Manufacturing:
Use: Overseeing project distribution across different production lines and strategic goals.
Presenter: Operations Manager
Audience: Production team, business advisors
Project management metrics with performance report with all 2 slides:
Use our Project Management Metrics With Performance Report to effectively help you save your valuable time. They are readymade to fit into any presentation structure.

FAQs for Project management metrics
So for KPIs, you definitely want to track if you're hitting deadlines and staying on budget - those are like the bare minimum. Scope completion matters too (did you actually deliver what you said you would?). Quality stuff like defect rates or how happy customers are is key. Oh, and resource utilization - seriously, burned out teams kill projects faster than anything. I'd also throw in stakeholder satisfaction and how well you're handling risks. Pick maybe 4-6 that your stakeholders actually care about rather than tracking everything. The exact ones depend on what kind of project you're running, but start with those basics.
Look for stuff that warns you early - sprint velocity, how fast code reviews get done, blockers getting cleared each week. Way better than waiting for things to blow up! Honestly, I wish I'd known this on my last disaster of a project lol. Put everything on dashboards where the whole team can see it, then actually talk about the numbers in standups instead of hiding them in Excel hell. The real magic happens when you use the data to figure out what's broken with your team. Oh, and don't go crazy - pick like 3-4 metrics that actually matter for your specific project.
So schedule variance is basically how you figure out if your project's on track or totally screwed. You take your earned value minus planned value (SV = EV - PV) - yeah it looks like math homework but honestly it's pretty simple once you've done it a couple times. Negative number means you're behind, positive means you're cruising ahead. Here's the thing though - don't just check this stuff at big milestones. Track it weekly or you'll miss problems brewing. I've seen too many projects where people ignored small negative variances early on, then suddenly they're three weeks behind with no clue how it happened.
Honestly, surveys are your best bet - just keep them short or people won't bother. I usually do quick questionnaires after big milestones asking about communication, whether expectations are being met, basic 1-10 scale stuff. Open-ended questions are clutch though, they catch things ratings totally miss. Also track meeting attendance and how many people actually respond to your emails - sounds weird but it tells you a lot. The trick is being consistent with timing so you can spot patterns. Oh, and definitely set up some kind of simple dashboard to watch these numbers. Trust me, catching problems early beats dealing with angry stakeholders later.
Start with resource utilization rate - basically what percentage of available hours your team actually worked. Capacity planning accuracy matters too (how close were your predictions to reality?). Cost per resource is pretty obvious but people forget to track it regularly. Resource contention rate shows when people are double-booked, which honestly drives everyone crazy. Skills matching percentage tells you if the right people are doing the right work. I'd check these weekly - waiting longer just lets problems snowball. Budget overruns will bite you fast if you're not paying attention to the cost stuff.
So basically EVM tracks three things - what you planned to spend (PV), what you actually spent (AC), and the value of work done (EV). The math looks intimidating at first, not gonna lie. But once you calculate those, you get performance ratios like SPI and CPI that tell you if you're behind schedule or over budget. I'd start with a solid baseline and track costs weekly. Way better than waiting months to realize you're screwed. The whole system just catches problems super early compared to regular tracking methods.
So CPI is basically how you know if you're hemorrhaging cash or not. Just divide earned value by actual costs - super simple math. Above 1.0? You're golden and under budget. Below 1.0? Yeah, you're overspending and need to panic a little. I'm obsessed with checking this weekly because catching problems early beats having awkward conversations with your boss later. Here's the brutal truth though - if you're consistently sitting below 0.9, don't expect some miracle turnaround. CPI gets pretty stubborn as projects drag on, so use those ugly numbers to start difficult budget talks now.
So qualitative metrics basically tell you the *why* behind your data. Like if you're 20% behind schedule, team interviews might show it's because requirements keep changing or everyone's burnt out. Numbers just show symptoms - the real causes come from actually talking to people. I do retrospectives, stakeholder interviews, sometimes just casual check-ins (honestly those work better than formal meetings half the time). The trick is pairing every big metric with asking "okay but why is this happening?" You'll get way more useful insights that way.
Honestly, start with what you already have - most teams don't even use half the reporting features in Asana or Trello. Jira's pretty solid for tracking progress and burndown charts. Monday.com too. Power BI and Tableau are flashy but sometimes a good Excel sheet gets the job done just as well (don't @ me). Microsoft Project is comprehensive but total overkill unless you're managing like 50+ people. The real trick? Pick whatever your team will actually update. I've seen too many fancy dashboards that look amazing but sit empty because nobody bothers maintaining them. Real-time data only works if people feed it real-time info.
Yeah, companies totally pick metrics that match what actually breaks their business. Construction folks obsess over safety incidents and weather delays - those will destroy your timeline fast. Software teams? They're all about velocity and bug rates since they're constantly pushing code. Healthcare projects get super paranoid about compliance because, you know, people could literally die. Manufacturing cares about throughput and defect rates. Honestly, just figure out what makes your executives panic at 2am - that's probably your most critical metric. Look at what failure looks like in your industry first, then build around avoiding those nightmare scenarios.
Honestly, the biggest trap is picking metrics that make you look good instead of showing what's actually happening. That velocity drop? Maybe your team was wrestling with some nightmare legacy code, not being lazy. I've seen people obsess over numbers that look pretty but tell you nothing about project health. Short bursts of data are basically useless - you want trends over weeks or months. Pick 3-4 metrics that actually matter for your project's success. Stick with those instead of jumping around every time something looks weird.
Work backwards from what your company actually wants. Revenue growth? Customer happiness? Faster launches? Whatever it is, tie your project metrics directly to that stuff. Don't track budget variance if leadership cares about speed to market - measure cycle time instead. Honestly, most PMs totally whiff on this connection and wonder why their reports get ignored. Pick maybe 3-5 metrics that'll make executives go "oh yeah, this matters." Keep it simple. When they see your dashboard, they should immediately get how your project moves the needle on business goals. It's really not rocket science once you think about it from their perspective.
Honestly, just give people what they actually care about. Executives want the big picture stuff - budget and timeline impacts. Project teams need the nitty-gritty details. Charts and dashboards are your friend because nobody's got time to parse through endless spreadsheets (learned that the hard way). When you say something like "we're 80% done," actually explain what that means for deadlines. Stick to a regular update schedule so people aren't constantly bugging you for status. Oh, and definitely call out both the good stuff AND potential problems early. Nobody likes getting blindsided later.
Think of metrics as your project's smoke detector - they catch problems while you can still do something about them. Track budget variance, schedule delays, quality issues, that sort of thing. I've watched way too many teams ignore obvious warning signs until everything's on fire. Set up alerts when numbers go outside normal ranges so you're not constantly staring at dashboards (honestly, who has time for that?). Pick metrics that match your biggest risks first. Monitor them regularly throughout the project. Way better than playing catch-up when things go sideways.
Look at your portfolio success rate and ROI trends first - that's where the real story is. Customer satisfaction scores matter too, obviously. Most teams obsess over delivery dates and budget stuff (I mean, fair enough) but honestly? Strategic alignment is way more telling. Like, how many projects actually support your main business goals? Team velocity shows if you're improving over time. Resource utilization is huge - nobody wants burned out people. Oh, and don't try tracking everything at once. Pick 3-4 things you can actually measure each quarter, then add more later.
-
Qualitative and comprehensive slides.
-
Unique design & color.
-
Qualitative and comprehensive slides.
-
Informative presentations that are easily editable.
-
Informative design.