

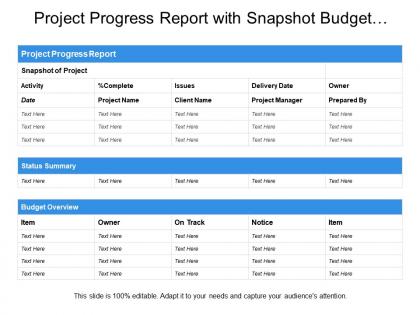
Project progress report with snapshot budget overview status summary




Try Before you Buy Download Free Sample Product
 Impress Your
 Audience
 100%
100% Editable
 Save Hours
 of Time


Discover great gains with our Project Progress Report With Snapshot Budget Overview Status Summary. Find facilities better than you imagined.
People who downloaded this PowerPoint presentation also viewed the following :
Project progress report with snapshot budget overview status summary with all 5 slides:
Convey information in a comprehensive fashion with our Project Progress Report With Snapshot Budget Overview Status Summary. It helps instruct folks.

FAQs for Project progress report with snapshot budget
Effective project progress reports should include current milestone status, budget utilization, timeline adherence, risk assessments, resource allocation updates, and next phase deliverables. These elements enable stakeholders to make informed decisions by providing comprehensive visibility into project health, potential roadblocks, and strategic adjustments needed, ultimately ensuring projects stay aligned with organizational objectives and deliver expected outcomes.
Visual aids enhance project progress reports by transforming complex data into easily digestible charts, graphs, timelines, and dashboards that highlight key milestones, budget variances, and timeline deviations. These visual elements streamline stakeholder communication, enable faster decision-making, and minimize misunderstandings, with many project managers finding that visual reports increase engagement and accelerate approval processes.
Common pitfalls include incomplete data collection, overly optimistic status updates, lack of stakeholder input, poor milestone tracking, and inadequate risk documentation. These reporting challenges can be streamlined by implementing standardized templates, regular team check-ins, and automated tracking systems, with many project managers finding that consistent, transparent communication ultimately delivers improved accountability and stakeholder confidence.
Project progress reports should typically be created weekly or bi-weekly for most projects, though frequency depends on project complexity, duration, and stakeholder needs. High-priority initiatives often require weekly updates, while longer-term projects may use monthly reporting cycles, with many organizations finding that consistent scheduling enhances transparency, enables proactive issue resolution, and maintains stakeholder engagement throughout project lifecycles.
Key metrics for measuring project progress include schedule variance, budget performance, scope completion percentage, milestone achievement rates, and resource utilization efficiency. These indicators enable project managers to identify potential delays, cost overruns, and resource bottlenecks early, while delivering real-time visibility into deliverable quality and timeline adherence, ultimately ensuring strategic objectives and stakeholder expectations.
**INPUT**: How can you ensure that your project progress report communicates challenges effectively? **OUTPUT**: Effective challenge communication requires clear problem identification, root cause analysis, impact assessment, and proposed mitigation strategies with realistic timelines. While transparency builds stakeholder trust, coupling challenges with actionable solutions demonstrates project leadership, with many organizations finding that honest, solution-focused reporting ultimately enhances credibility and enables faster resource allocation for resolution.
Technology streamlines project progress reports through automated data collection, real-time dashboard creation, integrated communication tools, and standardized template systems. These solutions enable project managers to generate comprehensive reports by automatically pulling metrics from various platforms, reducing manual compilation time, and ensuring consistent formatting, while many organizations find that automated reporting delivers faster stakeholder updates and enhanced project transparency.
Audience tailoring shapes report design by determining content depth, visual complexity, technical language, update frequency, and delivery format based on stakeholder needs. Executive audiences require high-level dashboards with strategic metrics, while project teams need detailed task breakdowns, with many organizations finding that customized reporting enhances decision-making speed and stakeholder engagement across all levels.
Incorporating feedback from previous reports improves next project updates by identifying communication gaps, addressing stakeholder concerns, and refining reporting formats for better clarity. Through systematic feedback analysis, project managers enhance transparency, streamline information delivery, and strengthen stakeholder engagement, with many organizations finding that iterative improvements ultimately deliver more actionable reports and improved project outcomes.
Best practices for presenting unfavorable project metrics include providing clear context around root causes, offering specific corrective action plans, maintaining transparency while focusing on solutions, and comparing current performance against revised realistic timelines. These approaches enhance stakeholder confidence by demonstrating proactive management and strategic problem-solving, with many organizations finding that honest communication paired with concrete recovery strategies ultimately strengthens project credibility and team trust.
Effectively summarizing complex project data involves creating visual dashboards with key metrics, milestone timelines, budget variance analysis, and risk assessments that highlight critical information at a glance. Through strategic data visualization and executive summaries, organizations streamline stakeholder communication, enhance decision-making transparency, and accelerate project approvals, with many finding that clear progress reporting ultimately delivers stronger stakeholder engagement and improved project outcomes.
Project milestone reporting should prioritize completion status against timeline, budget variance analysis, deliverable quality metrics, resource utilization rates, and risk assessment updates. These elements enable stakeholders to assess project health comprehensively, with many organizations finding that emphasizing upcoming dependencies and stakeholder impact analysis delivers enhanced decision-making capabilities and proactive issue resolution.
Balancing detail and brevity requires focusing on key milestones, critical risks, budget variances, and upcoming deliverables while eliminating routine updates that don't impact decision-making. Effective reports use executive summaries, visual dashboards, and exception-based reporting, with many project managers finding that stakeholder-specific sections deliver relevant information without overwhelming busy executives, ultimately enhancing project transparency and strategic oversight.
**INPUT**: What tools and software are recommended for creating professional project progress reports? **OUTPUT**: Recommended tools include Microsoft Project, Asana, Trello, Smartsheet, and PowerPoint for comprehensive reporting capabilities. These platforms streamline project tracking by automating data collection, generating visual dashboards, and creating customizable templates, with many organizations finding that integrated reporting tools ultimately enhance stakeholder communication and accelerate decision-making processes. [Word count: 52 words]
Consistency in project progress reporting is achieved through standardized templates, defined reporting schedules, clear metrics and KPIs, regular training sessions, and centralized tracking systems. These approaches streamline communication by establishing uniform formats, ensuring timely updates, and maintaining data accuracy, with many organizations finding that structured reporting frameworks ultimately deliver enhanced project visibility, improved accountability, and more efficient resource allocation across teams.
-
Unique design & color.
-
Much better than the original! Thanks for the quick turnaround.