

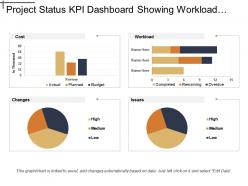
Project status kpi dashboard showing workload cost and issues





Try Before you Buy Download Free Sample Product
 Impress Your
Audience
 100%
Editable
 Save Hours
of Time


Folks are bound to heed your advice due to our Project Status Kpi Dashboard Showing Workload Cost And Issues. You will influence the debate.
People who downloaded this PowerPoint presentation also viewed the following :
Project status kpi dashboard showing workload cost and issues with all 5 slides:
Feel free and easy with our Project Status Kpi Dashboard Showing Workload Cost And Issues. They create a cheerful atmosphere.


FAQs for Project status kpi dashboard showing workload
Key performance indicators for project status dashboards include schedule variance, budget variance, scope completion percentage, resource utilization rates, and quality metrics like defect rates. These KPIs enable project managers to monitor progress, identify bottlenecks, and make data-driven decisions, with many organizations finding that comprehensive dashboards ultimately deliver improved project outcomes and enhanced stakeholder communication.
A project status KPI dashboard enhances decision-making by providing real-time visibility into project health, resource allocation, budget performance, timeline adherence, and risk indicators in one centralized view. Through automated data visualization, project managers can quickly identify bottlenecks, reallocate resources strategically, and make proactive adjustments, ultimately delivering improved project outcomes and stakeholder satisfaction.
Effective project status dashboards utilize progress bars for completion percentages, color-coded status indicators (red, yellow, green), timeline Gantt charts, milestone markers, and metric cards displaying key numbers. These visual elements enhance decision-making by providing instant comprehension of project health, resource allocation, and timeline adherence, with many project managers finding that strategic combinations of charts and indicators streamline stakeholder communication and accelerate response times.
Real-time data integration eliminates manual data entry delays, reduces human error, and ensures KPI dashboards reflect current project conditions through automated feeds from project management tools, resource tracking systems, and financial platforms. This seamless integration enables project managers to make informed decisions faster, identify potential bottlenecks earlier, and maintain accurate stakeholder communications, ultimately delivering improved project outcomes and enhanced operational efficiency.
Common challenges include defining relevant KPIs, ensuring data accuracy and integration from multiple sources, managing real-time updates, and balancing comprehensive information with visual clarity. These obstacles often stem from inconsistent data formats, stakeholder alignment issues, and technical limitations, with many organizations finding that successful dashboards require strategic planning, cross-functional collaboration, and iterative refinement to deliver actionable insights.
User experience design significantly influences project KPI dashboard effectiveness by streamlining data visualization, enhancing intuitive navigation, and ensuring relevant metrics are easily accessible to stakeholders. Through strategic layout design and interactive elements, organizations can minimize decision-making time, improve stakeholder engagement, and ultimately deliver faster project insights, with many teams finding that well-designed dashboards increase reporting efficiency by reducing information overload.
Stakeholder feedback plays a crucial role in developing effective project status KPI dashboards by identifying relevant metrics, defining success criteria, ensuring data accessibility, and aligning dashboard functionality with decision-making needs. Through collaborative input gathering, project managers can create dashboards that deliver actionable insights, streamline communication workflows, and enhance project transparency, with many organizations finding that stakeholder-driven dashboards significantly improve project oversight and strategic alignment.
Industries customize project status KPI dashboards by incorporating sector-specific metrics, compliance requirements, and operational priorities unique to their business models. Healthcare organizations focus on patient safety indicators and regulatory timelines, while manufacturing emphasizes production efficiency and quality control metrics, and financial services prioritize risk assessments and audit trails, ultimately delivering enhanced visibility and strategic alignment across diverse operational environments.
Recommended technologies include Power BI, Tableau, Qlik Sense, Google Data Studio, and custom solutions using React or Angular with D3.js visualization libraries. These platforms streamline data integration, automate real-time updates, and enhance stakeholder visibility through interactive reporting, with many organizations finding that cloud-based solutions deliver scalable analytics and faster decision-making capabilities.
Project status KPI dashboards should be updated daily or weekly depending on project complexity, timeline, and stakeholder needs, with critical projects requiring real-time updates and longer-term initiatives benefiting from weekly refreshes. Many organizations find that automated updates combined with scheduled reviews enable project managers to track progress, identify bottlenecks early, and maintain stakeholder alignment, ultimately delivering enhanced project visibility and faster decision-making capabilities.
Data integrity best practices include establishing automated data validation rules, implementing real-time synchronization across systems, conducting regular audits, defining clear data ownership responsibilities, and creating standardized input formats. Through centralized data governance frameworks, project teams streamline accuracy verification, minimize manual errors, and enhance reporting reliability, with many organizations finding that consistent validation protocols ultimately deliver more trustworthy insights and better decision-making capabilities.
Historical data analysis displayed on KPI dashboards enhances future project planning by identifying patterns in resource allocation, timeline accuracy, budget variances, and risk factors across completed projects. These insights enable project managers to create more realistic schedules, anticipate potential bottlenecks, and optimize team assignments, with many organizations finding that data-driven planning reduces project overruns by 20-30% while improving delivery predictability.
Project health metrics include schedule variance, budget utilization, resource allocation efficiency, milestone completion rates, and risk exposure levels. These indicators can be visually represented through color-coded progress bars, trend line charts, and traffic light status systems, with many organizations finding that real-time dashboard visualization enables faster decision-making, improved stakeholder communication, and ultimately delivers enhanced project outcomes.
Project status KPI dashboards facilitate communication by providing real-time visibility into project progress, milestone achievements, resource allocation, and potential risks through centralized, visual reporting. These dashboards enable project managers, team members, and stakeholders to quickly assess performance metrics, identify bottlenecks, and make data-driven decisions, ultimately streamlining collaboration and enhancing project transparency across organizations.
Including predictive analytics in project status KPI dashboards delivers early risk identification, resource optimization, timeline forecasting, budget variance prediction, and proactive decision-making capabilities. These analytical tools enhance project management by identifying potential bottlenecks before they occur, enabling strategic resource reallocation, and ultimately delivering improved project success rates, with many organizations finding that predictive insights reduce delays and cost overruns significantly.
-
Best way of representation of the topic.
-
Qualitative and comprehensive slides.