


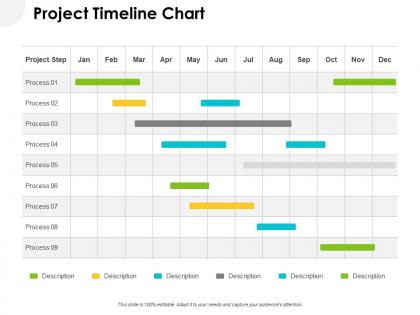
Project timeline chart ppt powerpoint presentation layouts deck




Try Before you Buy Download Free Sample Product
 Impress Your
Audience
 100%
Editable
 Save Hours
of Time


Derive excellent gains from our Project Timeline Chart Ppt Powerpoint Presentation Layouts Deck. They assure you fabulous dividends.
People who downloaded this PowerPoint presentation also viewed the following :
Project timeline chart ppt powerpoint presentation layouts deck with all 5 slides:
Gain the advantage with our Project Timeline Chart Ppt Powerpoint Presentation Layouts Deck. Acquire the edge from the beginning.

FAQs for Project timeline chart ppt powerpoint
Key components include task breakdown, duration estimates, dependencies, milestones, resource allocation, and critical path identification. These elements work together by providing visual clarity, enabling better resource management, and facilitating proactive risk mitigation, with many project managers finding that comprehensive timeline charts ultimately deliver improved stakeholder communication and enhanced project success rates.
Project timeline charts enhance team collaboration by providing visual clarity on task dependencies, deadlines, and individual responsibilities, while enabling real-time progress tracking and seamless information sharing. These tools streamline communication by centralizing project updates, milestone notifications, and resource allocation decisions, with many teams finding that shared timeline visibility reduces meeting frequency, minimizes miscommunication, and ultimately accelerates project delivery.
Microsoft Project, Gantt chart software like Smartsheet, Asana, Trello, and Monday.com are most commonly used to create project timeline charts. These tools streamline project management by enabling task scheduling, resource allocation, and progress tracking, with many organizations finding that visual timeline software enhances team collaboration and ultimately delivers improved project outcomes.
Customizing project timeline charts involves adjusting milestones, deadlines, task dependencies, resource allocations, and visual elements to match your project's scope and complexity. Through flexible formatting options, project managers can modify colors, add critical path indicators, and incorporate buffer times, with many organizations finding that tailored timelines enhance team communication, stakeholder alignment, and ultimately deliver better project outcomes.
Best practices for timeline charts include using consistent scaling, clear milestone markers, color coding for different phases, logical left-to-right progression, and distinct visual hierarchy. These design elements enhance project communication by streamlining stakeholder understanding, minimizing confusion during planning phases, and enabling teams to track progress more effectively, with many organizations finding that well-designed timeline visuals ultimately deliver improved project coordination and faster decision-making processes.
Gantt charts can be integrated into project timeline charts by serving as the visual backbone that displays task dependencies, resource allocation, and milestone tracking within the broader timeline framework. Through specialized project management software, teams can embed interactive Gantt elements directly into comprehensive timeline dashboards, enabling stakeholders to view both high-level project progression and detailed task sequences simultaneously, ultimately delivering enhanced project visibility and improved coordination across departments.
Milestones serve as critical checkpoints in project timeline charts, marking key deliverables, phase completions, decision points, and stakeholder review periods throughout the project lifecycle. These strategic markers enable project managers to track progress, identify potential delays, and maintain accountability across teams, while providing stakeholders with clear visibility into project advancement and upcoming deliverables.
Timeline charts facilitate project progress tracking by displaying task sequences, milestone dates, critical dependencies, and completion percentages in visual formats that enable quick status assessment. Through Gantt charts and milestone trackers, project managers can identify bottlenecks, adjust resource allocation, and communicate deadline risks to stakeholders, ultimately delivering improved project outcomes and enhanced team accountability.
Common challenges include inaccurate time estimations, resource conflicts, scope changes, dependency management issues, and stakeholder misalignment on priorities. These obstacles can be mitigated through collaborative planning sessions, buffer time allocation, regular review cycles, and clear communication protocols, with many project managers finding that flexible timeline frameworks ultimately deliver better outcomes while maintaining project momentum.
Ensuring project timeline charts remain dynamic requires implementing regular review cycles, establishing clear change management protocols, and utilizing collaborative project management software that enables real-time updates. Successful project managers schedule weekly timeline assessments, integrate stakeholder feedback loops, and maintain version control systems, with many organizations finding that automated tracking tools significantly enhance accuracy and team alignment.
**INPUT**: What are some examples of successful projects that effectively used timeline charts? **OUTPUT**: Successful timeline chart implementations include NASA's Apollo missions, construction projects like Dubai's Burj Khalifa, software launches at companies like Microsoft, pharmaceutical drug development pipelines, and major infrastructure initiatives. These projects leveraged timeline charts to coordinate complex dependencies, manage resource allocation across multiple teams, and maintain stakeholder alignment, ultimately delivering on-time completion and strategic competitive advantages. *[Word count: 60]*
Different industries tailor project timeline charts by incorporating sector-specific milestones, regulatory requirements, resource constraints, and stakeholder workflows that align with their operational demands. Healthcare organizations emphasize compliance checkpoints and patient safety protocols, while manufacturing focuses on supply chain dependencies and production cycles, ultimately enabling more accurate scheduling and enhanced project success rates across specialized environments.
Color coding in project timeline charts delivers enhanced visual organization, faster information processing, improved team communication, and clearer priority identification. Through strategic color assignments, project managers can instantly distinguish between departments, task statuses, and resource allocations, with many organizations finding that color-coded timelines reduce meeting times and accelerate decision-making across complex initiatives.
Project timeline charts enhance resource allocation by visualizing task dependencies, identifying resource conflicts, and revealing capacity bottlenecks across project phases. Through strategic timeline mapping, organizations streamline workforce distribution, minimize idle time, and optimize equipment utilization, with many project managers finding that visual scheduling reduces resource waste by 20-30% while accelerating delivery timelines.
Project timeline charts should include completion percentage, budget variance, resource utilization, milestone achievements, and quality metrics like defect rates or customer satisfaction scores. These metrics enable project managers to track progress against planned schedules, identify potential delays early, and make data-driven adjustments, with many organizations finding that comprehensive measurement ultimately delivers improved project outcomes and enhanced stakeholder confidence.
No Reviews