

Projected Profit And Loss Statement For Coffee Business Plan





Try Before you Buy Download Free Sample Product
 Impress Your
 Audience
 100%
100% Editable
 Save Hours
 of Time


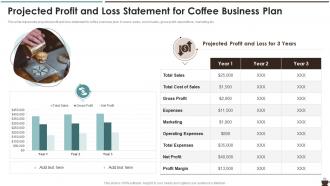
This slide represents projected profit and loss statement for coffee business plan. It covers sales, cost of sales, gross profit, expenditure, marketing etc.
People who downloaded this PowerPoint presentation also viewed the following :
Projected Profit And Loss Statement For Coffee Business Plan with all 7 slides:





FAQs for Projected Profit And Loss Statement For
A projected profit and loss statement should include revenue forecasts, cost of goods sold, operating expenses, depreciation, interest expenses, and tax provisions. These components enable businesses to anticipate financial performance, identify potential cash flow challenges, and make strategic decisions about resource allocation, with many organizations finding that detailed projections enhance investor confidence and operational planning.
Fixed costs remain constant regardless of production volume, including rent, salaries, insurance, and loan payments, while variable costs fluctuate with business activity like raw materials, shipping, and commission payments. This distinction enables accurate break-even analysis and profit margin calculations, with many businesses finding that properly categorizing these costs streamlines budgeting and enhances financial forecasting accuracy.
Revenue forecasts serve as the foundation of projected profit and loss statements, determining overall financial trajectory, resource allocation decisions, and strategic planning accuracy. These projections enable businesses to anticipate cash flow patterns, set realistic expense budgets, and identify growth opportunities, with many organizations finding that accurate revenue forecasting ultimately delivers better investment decisions and competitive positioning.
Businesses should update their projected profit and loss statements quarterly at minimum, with many organizations reviewing them monthly during periods of significant change or growth. This regular updating enables companies to track performance against forecasts, adjust strategies based on market conditions, and make informed financial decisions, ultimately delivering better resource allocation and competitive advantage in an increasingly dynamic business environment.
Methods for estimating future sales include historical data analysis, market research and trend analysis, customer surveys and feedback, competitor analysis, and economic indicator assessment. These approaches work together by combining past performance patterns, market intelligence, and customer insights to create realistic projections, with many organizations finding that using multiple methods simultaneously delivers more accurate forecasts and better strategic planning outcomes.
Seasonal trends significantly impact profit and loss projections by creating predictable revenue fluctuations, expense timing variations, and cash flow patterns that must be factored into forecasting models. Industries like retail, hospitality, and agriculture experience pronounced seasonal cycles, with many organizations finding that incorporating historical seasonal data, adjusting inventory levels, and planning marketing spend around peak periods ultimately delivers more accurate projections and better resource allocation.
Market research provides critical data for revenue forecasting, pricing strategies, customer demand analysis, and competitive positioning within projected profit and loss statements. Through comprehensive market analysis, businesses can establish realistic sales projections, identify cost structures, and anticipate market fluctuations, ultimately enabling more accurate financial planning and strategic decision-making in an increasingly competitive landscape.
Businesses can leverage historical data to inform projections by analyzing revenue trends, seasonal patterns, expense fluctuations, and growth rates from previous periods. This data enables more accurate forecasting by identifying recurring cycles, establishing baseline performance metrics, and adjusting for market changes, with many organizations finding that combining 3-5 years of historical performance with current market conditions delivers significantly more reliable financial projections.
**INPUT**: What financial ratios can be derived from a projected profit and loss statement? **OUTPUT**: Projected P&L statements enable calculation of profitability ratios including gross profit margin, operating margin, net profit margin, return on sales, and expense ratios. These financial metrics streamline performance analysis, enhance strategic planning capabilities, and deliver competitive insights, with many organizations finding that consistent ratio tracking ultimately strengthens investor confidence and operational decision-making. [Word count: 56 words]
Changes in tax regulations significantly impact projected profits by altering effective tax rates, available deductions, depreciation schedules, and compliance costs across different income brackets. Companies must regularly update their financial models to reflect new legislation, with many organizations finding that proactive tax planning and scenario modeling help maintain competitive advantage while ensuring accurate profit forecasting in an increasingly complex regulatory environment.
Common pitfalls include overly optimistic revenue projections, underestimating operational costs, ignoring seasonal fluctuations, failing to account for market competition, and overlooking regulatory compliance expenses. These projection errors can mislead stakeholders and impact strategic decisions, with many organizations finding that conservative estimates, thorough market research, and regular forecast updates deliver more accurate financial planning and enhanced investor confidence.
A projected profit and loss statement demonstrates financial viability to investors by showcasing anticipated revenue streams, expense management, and profitability timelines over specific periods. This financial roadmap enables startups and growing businesses to present compelling investment cases, with venture capitalists and banks finding that detailed projections reflecting realistic market assumptions, operational costs, and growth trajectories ultimately deliver increased funding confidence and strategic credibility.
Underestimating expenses in projections creates cash flow shortages, reduced profitability margins, investor credibility issues, and potential funding gaps that threaten operations. This miscalculation forces businesses into reactive cost-cutting, emergency financing, or delayed growth initiatives, with many organizations finding that conservative expense forecasting ultimately delivers stronger financial stability and stakeholder confidence.
Inflation rates significantly impact profit and loss projections by increasing input costs, affecting pricing strategies, and altering consumer purchasing power across revenue and expense categories. Organizations must adjust their forecasting models to account for rising material costs, labor expenses, and operational overheads, while simultaneously evaluating pricing flexibility and demand elasticity, ultimately requiring more dynamic financial planning approaches.
Charts, graphs, trend lines, color-coded categories, and visual indicators can significantly enhance projected P&L presentations by transforming complex financial data into accessible insights. These elements enable stakeholders to quickly identify revenue patterns, expense trends, and profitability trajectories, while interactive dashboards and comparative visualizations help organizations communicate financial projections more effectively, ultimately facilitating better strategic decision-making.
-
If you are looking for satisfactory PowerPoint services, SlideTeam is your go-to place. I am fully contented with their research and development team.
-
Such amazing slides with easy editable options. A perfect time-saver.