


Pyramid depicting kpi for it department performance evaluation





Try Before you Buy Download Free Sample Product
 Impress Your
Audience
 100%
Editable
 Save Hours
of Time


Our Pyramid Depicting KPI For IT Department Performance Evaluation are topically designed to provide an attractive backdrop to any subject. Use them to look like a presentation pro.
People who downloaded this PowerPoint presentation also viewed the following :
Pyramid depicting kpi for it department performance evaluation with all 2 slides:
Use our Pyramid Depicting KPI For IT Department Performance Evaluation to effectively help you save your valuable time. They are readymade to fit into any presentation structure.
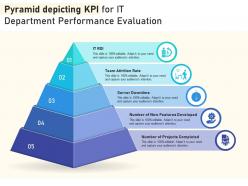

FAQs for Pyramid depicting kpi for it
So basically you're building a pyramid, right? Top level has your big company goals - the stuff executives obsess over. Then you work down to smaller metrics that actually feed into those bigger ones. Day-to-day operational stuff sits at the bottom. Honestly, most companies totally mess this up and just track random things. But when it works, everyone can see how their daily tasks connect to what matters. Start with like 3-5 major strategic goals first. Then figure out what tactical metrics support those. It's way more straightforward than people make it sound.
So basically, your KPIs work like a pyramid - the big strategic ones at the top (revenue growth) get supported by operational stuff in the middle (how many customers you're getting and keeping), and then all the little day-to-day metrics at the bottom (website traffic, email clicks, whatever). It's kinda like dominoes though - when those bottom metrics tank, you'll definitely see it mess with everything above them. Honestly, I'd start by just sketching out how they all connect to each other. That way you can actually figure out which buttons to push when you need to move the important numbers.
Honestly, the pyramid thing is a game-changer for KPIs. You can actually trace everything from your big business goals down to the day-to-day stuff that moves the needle. No more random dashboards that make zero sense together. When metrics tank, you don't just sit there confused - you can dig down level by level to figure out what's broken. Each team sees how their work connects to the bigger picture too. I'd start with maybe 2-3 main outcomes at the top and build from there. Way less overwhelming than trying to track everything at once.
Honestly, most companies mess this up from the start. Pick KPIs that actually show if you're hitting your big goals - not just random metrics that sound fancy. Break those down for each team so they get more specific as you go down the ladder. I swear, half the time middle management just loses the thread completely! Your department goals should obviously connect back to the main ones above them. Check in regularly because priorities change and you don't want people working toward last quarter's objectives. Oh, and definitely map it out visually - people need to see how their daily grind actually matters to the bigger picture.
You really need everyone on board from the start when you're building that KPI pyramid. Different people care about different levels - finance guys obsess over the big picture numbers while ops teams get into the weedy details at the bottom. I'd start by actually talking to your key stakeholders about what success means to them. Map out who needs which metrics, then build the whole thing together instead of hiding in a corner doing it yourself. The tricky part is getting everyone aligned on how those metrics connect and flow down through the pyramid. Trust me, do it collaboratively or you'll be rebuilding it later.
KPI pyramids are honestly game-changers for decision-making. They link your big strategic goals directly to the daily stuff your team can actually control. Think of it like having clear directions instead of wandering around blind. Your major objectives sit at the top, then everything flows down to the metrics that actually matter. No more getting distracted by numbers that look cool but don't move anything forward (learned that one the hard way). Just pick your top 3 strategic goals first, then figure out which day-to-day metrics actually push those forward. Makes everything click into place.
Honestly, the worst thing you can do is overcomplicate it. I've seen people build these massive pyramids with like 50 metrics - total nightmare. Pick KPIs that actually change behavior, not just ones that are easy to track. Oh, and make sure everything connects properly. Your day-to-day operational stuff should roll up to your big strategic goals, otherwise you're just measuring random things for no reason. Keep someone accountable for each metric too. Simple is better here - your pyramid should tell one clear story from top to bottom.
Quarterly works for most businesses, but honestly it depends on your industry's pace. Top-level strategic stuff? Maybe once a year is fine. The day-to-day operational metrics though - those need monthly attention. I've watched companies drive themselves crazy tweaking numbers every single week (such a time suck). Quarterly hits that sweet spot where you've got real data to work with, not just random fluctuations. Set those calendar reminders right now or you'll totally space it. And actually do something with what you discover - don't just collect dust on spreadsheets.
Honestly? PowerPoint or Google Slides are perfect for basic pyramids - most people way overthink this stuff. Your team probably already uses one of those anyway. Excel's actually pretty solid too if you're decent with shapes and formatting. Want something fancier? Lucidchart or draw.io work well for flowchart-style pyramids. Tableau and Power BI are overkill unless you need live data connections, which... do you really? Start simple with whatever tool everyone knows. You can make it prettier later once you've got the structure figured out.
So basically you take your big company goals and break them down into bite-sized pieces everyone can actually understand. Start at the top with your main objectives, then work your way down through each department. Each team gets their own specific metrics, but - and this is key - everything still connects back to the bigger picture. Your front-line people aren't just shooting in the dark anymore. They've got clear targets that actually matter for overall success. Honestly, most companies I've seen do this backwards or not at all. Map out what you've got now first, then you'll spot the gaps pretty quick.
Think of it like this - CEO metrics go at the top. Revenue growth, customer lifetime value, that kind of stuff. Then you work down to the nitty-gritty operational things like daily users or conversion rates by channel. It's basically asking "are we winning?" at the top, then "what's actually driving this?" at the bottom. Honestly, I've found it way easier to start with whatever success looks like to executives first. Then just trace backwards to figure out which daily actions actually move those big numbers. Short sentences for the granular stuff. Broader impact metrics live up top - makes the whole thing feel less overwhelming.
So basically you just swap in the metrics that actually matter for your business. Retail companies track conversion rates and inventory stuff, while SaaS people care more about user engagement and churn - makes sense, right? The pyramid structure stays the same though. Strategic goals still go at the top, day-to-day operational stuff at the bottom. But honestly, the content changes completely depending on your industry. Healthcare folks obsess over patient outcomes, manufacturing is all about efficiency and safety metrics. Just figure out what actually moves the needle for you and build around that.
Look at Amazon - they start with revenue, then drill down to conversion rates, page load times, search relevancy stuff. Netflix does something similar linking subscriber growth to how much people actually watch their shows, then tracking completion rates and recommendation clicks. My old company tried this with customer support too, honestly. Started with NPS scores, broke it down to how fast we solved problems, then first-call resolution. The trick is making sure your metrics actually connect to each other - you can't just grab whatever sounds impressive. Map yours out first and see if the bottom stuff really moves the needle on the top line metrics.
Honestly? Employee engagement makes or breaks the whole KPI thing. Without it, you're basically making pretty charts nobody gives a damn about. Here's what I've noticed - when people actually get how their day-to-day stuff ties into the bigger metrics, they start caring way more about performance. The biggest mistake I see is leadership just throwing numbers at teams from above without explaining why these metrics matter. People need to feel like they own their piece of it. My advice? Get your teams involved in picking their own KPIs when you can. They'll actually try to hit targets they helped choose. Makes total sense when you think about it.
Three things you gotta nail down for KPI pyramid training. Data analysis basics first - your people need to get how metrics actually connect up the chain. Strategic thinking workshops are key too, so everyone sees how their daily stuff impacts the big picture. Oh, and make sure they really know your dashboards and tools. Seriously, watching people hunt around for reports is painful and kills all your momentum. I'd probably do a half-day session on the framework, then dive into hands-on tool practice right after.
-
Very unique and reliable designs.
-
Innovative and attractive designs.
-
Easy to edit slides with easy to understand instructions.
-
Content of slide is easy to understand and edit.