

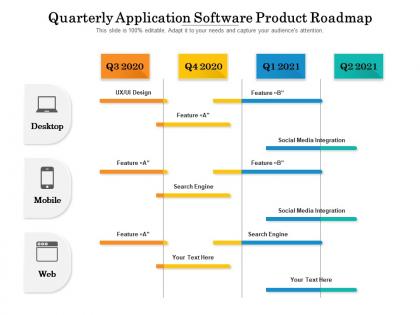
Quarterly application software product roadmap




Try Before you Buy Download Free Sample Product
 Impress Your
 Audience
 100%
100% Editable
 Save Hours
 of Time


Visualize your work plan and communicate your ideas impactfully with our pre designed Quarterly Application Software Product Roadmap. Showcase the detailed overview of the project, the key deliverables, and the milestones to be achieved with the help of our fully customizable PowerPoint layout. You can easily emphasize on the project goals and discuss all the activities involved in an easy to comprehend manner by utilizing our professionally designed PPT theme. This roadmap PowerPoint layout is a perfect strategic planning tool that can help in keeping the project on track. With our attractive PowerPoint theme, you can articulate the workflow, track the work progress, and have a clear vision of the goal to be achieved. Download this versatile Quarterly Application Software Product Roadmap and save your hours of work.
People who downloaded this PowerPoint presentation also viewed the following :
Quarterly application software product roadmap with all 2 slides:
Give your audience a fulfilling experience. They will find our Quarterly Application Software Product Roadmap elevating.

FAQs for Quarterly application
A quarterly roadmap presentation should include key performance indicators (KPIs), strategic objectives, project timelines, resource allocation, and potential roadblocks. These components, presented in a visually engaging way, help teams understand priorities, track progress, and make informed decisions. Many organizations find that clearly outlining these elements fosters alignment across departments and enhances overall strategic execution.
Creating a clear quarterly roadmap involves visually mapping out goals and milestones to enhance team alignment and progress tracking. Businesses can effectively visualize this by utilizing project management tools, interactive Gantt charts, or even simple Kanban boards, each offering distinct benefits for different workflows. These tools enable teams to break down large objectives into smaller, manageable tasks, assign responsibilities, and monitor progress in real-time, ultimately leading to increased transparency, accountability, and successful goal achievement.
Using templates for creating quarterly roadmaps offers several benefits, including streamlined planning, consistent structure, and improved collaboration. These templates provide a pre-defined framework, enabling teams to allocate resources effectively, track progress seamlessly, and align individual goals with overall objectives. Many organizations, particularly in fast-paced sectors like tech and marketing, find that these structured approaches enhance efficiency and deliver clearer strategic direction.
A quarterly roadmap aligns with long-term strategic planning by breaking down ambitious goals into manageable, actionable steps. It translates overarching objectives into specific, time-bound initiatives, ensuring progress is tracked and resources are allocated effectively. Financial services companies, for example, can use quarterly roadmaps to implement their five-year growth strategy, focusing on new product launches, market expansion, or customer acquisition in each quarter, ultimately driving sustainable business growth.
Assessing progress against a quarterly roadmap involves methodologies that blend quantitative and qualitative data. Key approaches include regular performance reviews, progress tracking dashboards, stakeholder feedback surveys, and comparative analysis against key performance indicators (KPIs). These methodologies, when used strategically, enable organizations to identify deviations, celebrate successes, and make informed adjustments to stay on track with quarterly objectives, ultimately ensuring efficient resource allocation and achievement of strategic goals.
A flexible quarterly roadmap ensures teams can adapt to market changes by incorporating regular reviews and incorporating agile methodologies. These methodologies prioritize iterative development, allowing for adjustments based on real-time feedback and emerging trends, enabling teams to stay ahead of the curve and capitalize on new opportunities while mitigating potential risks.
Stakeholder feedback plays a crucial role in shaping a quarterly roadmap by ensuring alignment with organizational goals and priorities. It provides valuable insights into departmental needs, potential roadblocks, and emerging market trends, allowing for adjustments to resource allocation and strategic initiatives. For example, in a technology company, feedback from sales and customer support teams can highlight the need to prioritize features that address customer pain points, ultimately driving product development and customer satisfaction.
Creating collaborative quarterly roadmaps involves aligning departmental goals with the overall organizational strategy, which can be achieved through regular cross-functional communication and shared planning sessions. These sessions allow departments to identify dependencies, share resources, and ensure their individual roadmaps contribute to the bigger picture, ultimately streamlining workflows and enhancing organizational efficiency while minimizing redundancies and conflicts.
Effective quarterly roadmap tools streamline planning, collaboration, and progress tracking. Popular options include project management software like Asana, Monday.com, and Trello, which offer customizable templates, task assignments, and visual progress dashboards. These platforms enable teams to define clear objectives, allocate resources effectively, and visualize progress across departments, ultimately enhancing transparency and accountability within organizations.
Integrating performance metrics into a quarterly roadmap ensures alignment between strategy and execution. By establishing clear, measurable goals for each quarter, teams can track progress, identify areas for improvement, and make data-driven decisions. For instance, a financial services firm might track customer acquisition costs and loan approval rates, while a manufacturing company could focus on production efficiency and defect rates. This data-driven approach enables organizations to stay on track, optimize performance, and ultimately achieve their long-term objectives.
Planning a quarterly roadmap presents both challenges and opportunities. Common pitfalls include setting overly ambitious goals, neglecting to incorporate stakeholder feedback, and failing to account for unexpected changes or disruptions. Many organizations find that a flexible approach, incorporating regular reviews and adjustments, leads to more effective roadmaps. Ultimately, a well-structured roadmap should be a dynamic tool that guides progress while adapting to evolving circumstances.
Quarterly roadmaps foster accountability by clearly defining objectives, assigning responsibilities, and setting measurable milestones for each team and individual. Through regular progress reviews and transparent communication, organizations can track performance against these goals, identify roadblocks early on, and ensure everyone is aligned with strategic priorities, ultimately driving greater efficiency and achieving desired outcomes.
A quarterly roadmap supports employee engagement and motivation by providing clear goals, outlining individual contributions, and fostering a sense of shared purpose. It allows employees to see how their work aligns with larger organizational objectives, especially in dynamic environments like those in tech or retail, where goals and priorities can shift frequently. With transparent progress tracking and milestones, employees feel empowered, contributing to a more engaged and motivated workforce.
Visual elements, such as charts, graphs, and icons, can significantly enhance the effectiveness of a quarterly roadmap presentation by making complex information more digestible and engaging. These visuals streamline the presentation of key milestones, progress indicators, and strategic objectives, allowing stakeholders to grasp the overall plan quickly and effectively. With many organizations finding that visual presentations lead to better comprehension and retention, incorporating these elements can ultimately drive better alignment and collaboration across teams.
Communicating quarterly roadmap updates to the wider team involves strategies like utilizing visual dashboards, hosting interactive workshops, and sending concise email summaries. These methods present both challenges and opportunities by ensuring transparency while avoiding information overload, with many teams finding that visual representations enhance understanding and engagement, ultimately leading to better alignment and collaboration.
No Reviews