


Quarterly Business Performance Review Dashboard





Try Before you Buy Download Free Sample Product
 Impress Your
Audience
 100%
Editable
 Save Hours
of Time


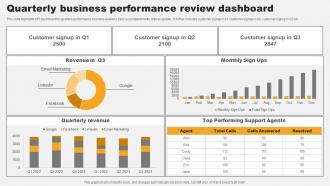
This slide highlights KPI dashboard for quarterly performance business review to track accomplishments of three quarter. It further includes customer signup in q1, customer signup in Q2, customer signup in Q3 etc.
People who downloaded this PowerPoint presentation also viewed the following :
Quarterly Business Performance Review Dashboard with all 10 slides:
Use our Quarterly Business Performance Review Dashboard to effectively help you save your valuable time. They are readymade to fit into any presentation structure.








FAQs for Quarterly Business
Honestly, I'd stick to the big four first: revenue growth, how you're gaining/keeping customers, operational efficiency, and profit margins. That combo tells you if things are actually working. Then maybe add some forward-looking stuff like your sales pipeline or customer satisfaction - way better than just staring at last month's numbers. Don't go crazy though, like 8-12 metrics tops or you'll hate checking them. I learned that the hard way! Start there and toss in whatever's specific to your industry. Keep it simple so you'll actually look at the dashboard.
Honestly, charts and graphs are a game changer for quarterly reports. You can spot trends instantly instead of staring at endless spreadsheet rows trying to make sense of everything. Bar charts work really well when you're comparing different departments. Line graphs show you how things changed over time - super useful. Heat maps are perfect for finding trouble spots fast (I use these all the time). The trick is matching the right chart type to your data. Don't just dump everything into pie charts because they're easy to make.
Honestly, you've gotta tie your KPIs to whatever actually makes money in your space. Manufacturing? Track OEE and cycle time. SaaS? Go with MRR, churn, customer acquisition cost. Don't just steal what everyone else is doing - I've seen so many companies mess this up. Pick maybe 5-7 metrics that actually move the needle for your industry's value drivers. Oh, and make sure you can consistently measure them each quarter. Nothing's more annoying than a dashboard saying "data unavailable" everywhere. Try focusing on leading indicators when you can since they let you pivot faster.
Honestly, quarterly dashboards are clutch for executives who need to make big decisions fast. You get revenue trends, operational stuff, market data - all in one spot instead of hunting through random spreadsheets. Board meetings become way less stressful when you can actually see what's happening. Patterns jump out at you, so you catch problems before they blow up. Plus you can pivot strategy based on real data instead of just winging it. I mean, gut instincts are fine but they don't hold up in those rooms, you know?
Honestly, Tableau or Power BI are your best bet if you can swing the cost - they handle messy data like champs. Google Data Studio is solid and free, though who knows what they'll call it next week lol. Excel works but gets annoying fast with multiple data sources. You could try Notion or Monday.com for basic stuff, but they're pretty limited for real analytics. My advice? Start with whatever tool your team's already using for data. Trust me, you don't want to deal with integration nightmares on top of everything else.
Honestly, I'd say monthly at minimum, but every two weeks is way better. Yeah I know that sounds crazy for "quarterly" stuff, but trust me - people want fresh data, not numbers from forever ago. Bi-weekly updates let you catch weird data issues before they become a problem. Monthly is fine if you're swamped, but you'll be scrambling when stakeholders start asking questions. Regular updates help you spot trends early too. Way less stressful than realizing something's off right before your big quarterly meeting.
Honestly, the worst thing you can do is cram everything onto one screen. Keep it to like 5-7 metrics that actually matter for your goals - otherwise nobody will use the damn thing. Skip the vanity stuff too (page views are basically useless unless you're selling ads). Your data needs to update automatically because stale numbers kill trust instantly. Oh, and make sure it works on mobile since everyone checks this stuff on their phones now. Before building anything, just ask yourself: "what decisions will this actually help us make?" Work backwards from there. Saves so much time.
Honestly, getting user feedback is what separates dashboards people actually use from ones that just sit there looking fancy. Ask them which metrics they care about most and how they want to see the data laid out. Quick surveys work great, or just grab 15 minutes with users monthly to chat about what's working. I've watched "meh" dashboards become total game-changers once teams started listening to feedback. Oh, and make it super easy to share thoughts - maybe throw a feedback button right in there. People won't tell you what's broken if it's a hassle to report it.
Okay so basically you want your quarterly dashboard to tell a story instead of just throwing random numbers at people. Like don't just say "revenue up 12%, costs down 3%" - connect the dots! Show how that marketing campaign actually drove the revenue jump, which then let you streamline operations. I always think of it as turning spreadsheet chaos into a "here's what went down and why" explanation. Arrange your charts so they build on each other - execs should be able to follow the cause-and-effect without getting lost. Start with your main point, then each visual supports that storyline.
Look back at 4-6 quarters of data and you'll start seeing the real patterns. Seasonal stuff becomes obvious. You can actually tell which projects made a difference vs the ones that flopped. It's way better than just guessing what'll happen next quarter - though honestly, most people still just wing it anyway. The historical trends help you set targets that aren't completely unrealistic. Plus you get to see where your original assumptions were totally wrong, which is always fun. Use those insights to figure out what's actually working and pivot your strategy accordingly.
Your CRM's got all the sales pipeline stuff you need, plus customer data. Financial systems are obvious - revenue, costs, the basics. Marketing platforms will give you lead gen numbers. But honestly, don't sleep on operational data like inventory levels or support tickets. That's where you'll find the real performance trends hiding. HR systems can show headcount changes and productivity too. The trick isn't dumping everything together - pick 3-4 sources that actually connect to your main KPIs first. You can always add more later once you've got that foundation working.
Start super simple - clean visuals, easy navigation. Don't cram everything on one screen, trust me on this one. You've got executives wanting big picture stuff and analysts needing all the nitty-gritty details, so build different views they can drill into. Color-coding works great (green = good, red = fix this), but definitely test it with real people first. What seems obvious to you might totally confuse them. Add quick explanations or tooltips for your main metrics. Oh, and do a walkthrough session right when you launch - you'll spot problems instantly that you never saw coming.
You really need at least 8-12 quarters of data to see what's actually happening with your business. Looking at current numbers alone is pretty useless - you'll miss seasonal patterns, growth trends, all that stuff. When I first started doing this, I made that mistake constantly. Historical comparisons show you when something's genuinely off versus just normal fluctuation. Plus you can set realistic goals based on what you've actually done before, not just pulling numbers out of thin air. It's like having the full story instead of random snapshots that don't mean much.
Honestly, mobile access is a game changer for dashboards. Your executives will actually use the thing when they can check numbers during their Uber rides or whatever. I've seen teams get like 3x more views just by making it mobile-friendly. The big win is people can make quick decisions on the spot instead of waiting to get back to their computer. Just make sure the text isn't microscopic and buttons are big enough to tap easily - that's where most companies screw up. Oh, and quarterly results during commutes? Yeah, that's definitely happening more now.
Okay so first thing - set up validation rules that catch weird data before it even hits your dashboard. I made this mistake once and showed completely wrong numbers to my boss, super embarrassing. You need someone owning each metric too, otherwise nobody takes responsibility when things break. Build in audit trails so you can trace back where bad data came from. Also do reconciliation between your dashboard and the actual source reports. The business users are honestly your best friends here - they'll spot stuff that doesn't make sense way faster than any automated check will.
-
I had them make a presentation for an office retirement party. They were very helpful in understanding what we wanted and delivered the perfect presentation. Highly recommended!
-
These stunning templates can help you create a presentation like a pro.