

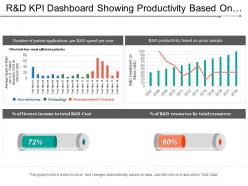
R and d kpi dashboard showing productivity based on gross margin





Try Before you Buy Download Free Sample Product
 Impress Your
Audience
 100%
Editable
 Save Hours
of Time


Chew the cud with our R And D Kpi Dashboard Showing Productivity Based On Gross Margin. Ideas that emerge will be absolutely brilliant.
Presenting this set of slides with name - R And D Kpi Dashboard Showing Productivity Based On Gross Margin. This is a three stage process. The stages in this process are R And D, Research And Development, Research And Technological Development.
People who downloaded this PowerPoint presentation also viewed the following :
R and d kpi dashboard showing productivity based on gross margin with all 6 slides:
Keep your thoughts always electric. Cut out disturbances with our R And D Kpi Dashboard Showing Productivity Based On Gross Margin.


Most Relevant Reviews
-
Innovative and attractive designs.
-
Much better than the original! Thanks for the quick turnaround.