

Real Estate Rental Portfolio Dashboard





Try Before you Buy Download Free Sample Product
 Impress Your
Audience
 100%
Editable
 Save Hours
of Time


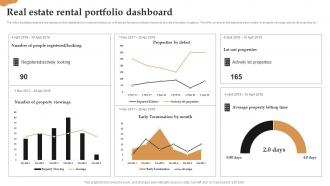
The following slide presents a real estate portfolio dashboard for rental and letting out with key performance indicator metrics to provide information at glance. The KPIs covered in this dashboard are number of property viewings, actively let properties etc.
People who downloaded this PowerPoint presentation also viewed the following :
Real Estate Rental Portfolio Dashboard with all 7 slides:
Use our Real Estate Rental Portfolio Dashboard to effectively help you save your valuable time. They are readymade to fit into any presentation structure.






FAQs for Real Estate
Track your property views and how many leads actually convert - that's where the money is. Time on market matters too, obviously. I'd also watch your sale price vs what you listed for, plus how long deals take to close. Lead sources are huge for figuring out where to spend your marketing budget. Don't sleep on tracking inventory by neighborhood and price range either. Pipeline health with deal stages, commission per transaction, monthly recurring revenue if you do property management. Honestly, start with these basics first - you can get fancy with market share analysis once you've got the fundamentals down.
Dude, visualizations are a game changer for market data. What used to take me hours digging through spreadsheets now jumps out in seconds on a good chart. Price movements, neighborhood heat maps, comparative graphs - they all help you catch patterns like seasonal dips or areas about to blow up. I was skeptical at first (probably because I'm terrible with tech), but interactive dashboards literally show market shifts as they happen. Your clients will get it instantly too. Start simple with line charts for price trends, then build from there. Trust me on this one.
Honestly, data integration makes or breaks everything. You don't want to be stuck updating spreadsheets manually - trust me, been there and it sucks. When your MLS, CRM, market data, and financials all talk to each other automatically, you actually get useful real-time info instead of just pretty charts. Makes decisions way faster too. I'd start with whatever systems you're checking most often during the day. Those should connect first. The whole point is having one place to look instead of bouncing between five different platforms like some kind of data detective.
So here's the thing - when people can customize their dashboards, they only see what actually matters to them. Agents get their lead tracking stuff up front. Property managers see maintenance requests and occupancy numbers. Investors? They want those ROI numbers staring them in the face. It's honestly way better than juggling five different tools (which is such a pain). The trick is keeping customization dead simple - otherwise nobody bothers using it. I'd start by figuring out the 3-5 metrics each type of user obsesses over, then build your widgets around those core things.
Dude, definitely go with interactive maps over those boring address tables. Color-code everything - prices, property types, whatever helps spot trends fast. Heat maps are clutch for showing where all the action is, and honestly your clients will eat that visual stuff up. You'll want smooth zooming from neighborhood view down to individual houses. Oh, and put the filters right on the map - price, bedrooms, all that. One thing that's huge: satellite view toggle. People actually want to see what the neighborhood looks like, not just some generic street layout.
Daily updates are your sweet spot for most real estate dashboards. The market honestly moves way faster than people think - new listings pop up, prices shift, you know how it is. Hot markets or luxury stuff? Go hourly if you can swing it, those segments are crazy volatile. Weekly *might* work if you're in a sleepy market, but any longer and you're basically making decisions with old news. I'd start daily and see how your specific area behaves - some markets are just different. Your users will tell you pretty quick if they need fresher data.
Honestly, start with price forecasting and rental yield predictions - those are gonna directly hit your ROI numbers. You want models showing 1-5 year appreciation plus what rents should look like based on local trends. Risk assessment scores are clutch too, especially the ones factoring in neighborhood stability and economic stuff. Cash flow projections will show you when properties actually become profitable, which is obviously key. Market timing indicators are pretty useful for figuring out if you're buying/selling at the right time in specific areas. I'd probably focus on the price and yield forecasts first though since everything else kinda builds from there.
Honestly, mobile responsiveness is huge for real estate dashboards. Most people browse properties on their phones now - I mean, when's the last time you pulled out a laptop to check listings? Your dashboard needs to work perfectly on tablets and phones, not just desktops. It also helps people with disabilities who use voice control or screen readers on mobile devices. Touch navigation gets way better too, and text becomes actually readable on smaller screens. Skip this and you're basically ignoring like 70% of your potential clients who expect everything to work on their phones first.
Honestly, less is more here. Start with maybe 5-7 key metrics that actually matter - lead conversion, days on market, commission stuff. I've seen way too many dashboards that look like NASA control panels and nobody uses them. Real-time data is huge because stale listings make you look amateur. Also, don't make people hunt through a bunch of screens for basic info - that's just annoying. Oh, and definitely test it with actual agents first. They'll tell you what's missing or what sucks. You can always add more metrics later based on what they're actually asking for.
Honestly, a dashboard is a game-changer because you're not scrambling through random Excel files at midnight anymore. It shows all your important stuff in one spot - occupancy rates, rent money coming in, maintenance headaches. Problems become obvious way earlier instead of sneaking up on you. I mean, you can actually see which buildings are tanking before they drain your whole portfolio. Set up alerts for whatever keeps you up at night. Track tenant complaints, spot maintenance patterns, figure out why that one property always costs more than it should. Way better than guessing.
Honestly, diving into your historical data is the best place to start. I'd pull 3-5 years of stuff like median prices, days on market, and how different neighborhoods have grown. Seasonal patterns are huge - like how spring always gets crazy busy. Set up some trend lines and moving averages in your dashboard so you can actually see where things might go next quarter. Machine learning can crunch all those numbers way faster than doing it by hand (which would take forever). Past inventory levels and sales velocity will show you cycles that keep repeating. It's pretty cool once you start seeing the patterns emerge.
Dude, focus on cash flow first - that's your bread and butter. Cap rate and ROI tell you if you're actually profitable or just fooling yourself. Cash-on-cash return is clutch for seeing how your down payment's working for you. Don't sleep on occupancy rates either, vacancy will wreck your numbers fast. I learned this the hard way lol. Track your expense ratio too because maintenance costs sneak up on you. Oh and set alerts when stuff drops below your targets - you'll thank me later when you catch problems early.
Honestly, just throw a feedback widget right in your dashboard - people won't bother if they have to hunt for it. Track what features actually get used and where everyone bails out, then ask specific questions about those problem spots. In-app surveys work great, but don't sleep on actual user interviews either. Analytics will show you the "what" but talking to people tells you the "why." The biggest mistake is doing this once and forgetting about it. Pick one method this week, then make yourself review responses every month to figure out what to fix next.
Tableau and Power BI are your best bets for real estate dashboards - both handle property data and market trends really well. Google Data Studio works too if budget's tight. I'd probably lean toward Power BI if you're starting fresh since it connects easily with Excel and isn't as intimidating as Tableau can be at first. The main thing is getting your MLS feeds, CRM data, and whatever market analytics you use all talking to each other. Oh, and I've honestly seen some pretty slick dashboards in all three platforms, so you can't really go wrong.
Honestly, dashboards are pretty clutch for keeping everyone on the same page. Your team and clients can check property details, market data, deal progress - all in one spot instead of playing phone tag constantly. Clients love being able to log in whenever and see how their listing's doing or browse search results. Makes them feel way more in the loop. Set up notifications so important stuff hits the right people automatically. I used to spend half my day updating people on the same info over and over. Now everyone just checks the dashboard and boom - no more "hey what's happening with the Johnson property" calls every five minutes.
-
The PPT layout is great and it has an effective design that helps in presenting corporate presentations. It's easy to edit and the stunning visuals make it an absolute steal!
-
Awesome use of colors and designs in product templates.