

Research Flowchart Powerpoint Ppt Template Bundles





Try Before you Buy Download Free Sample Product
 Impress Your
Audience
 100%
Editable
 Save Hours
of Time


Introducing our comprehensive Research Flowchart PowerPoint presentation This meticulously designed PPT is your ultimate guide to navigate through the intricate process of research. Whether you are a seasoned researcher or just starting your academic journey, this presentation covers it all. Explore the key elements such as Data Collection, Hypothesis Testing, Experimental Design, and Data Analysis, all seamlessly integrated into a well defined Research Methodology. Our user friendly flowchart simplifies complex research procedures, making it easier for your audience to grasp and engage with your research findings. Empower your presentations with clarity and precision, allowing you to communicate your research process effectively. This PPT is a valuable tool for students, educators, and professionals in various fields, ensuring your research stands out and is easily comprehensible.
People who downloaded this PowerPoint presentation also viewed the following :
Research Flowchart Powerpoint Ppt Template Bundles with all 22 slides:
Use our Research Flowchart Powerpoint Ppt Template Bundles to effectively help you save your valuable time. They are readymade to fit into any presentation structure.

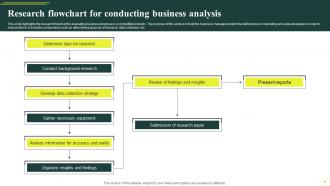


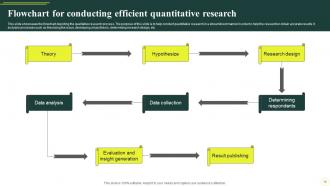
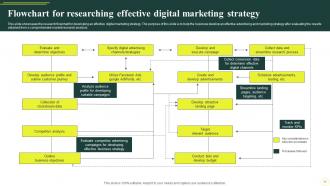








FAQs for Research Flowchart Powerpoint
Research flowchart templates should include research objectives, literature review phases, methodology selection, data collection processes, analysis stages, and result interpretation steps. These components streamline academic and business research by providing clear decision points, timeline management, and quality checkpoints, with many organizations finding that structured templates enhance research efficiency, minimize overlooked steps, and ultimately deliver more comprehensive, actionable insights.
A research flowchart enhances methodology clarity by visually mapping each research phase, decision point, data collection method, and analysis step in sequential order. This visual representation enables researchers to identify potential gaps, streamline processes, and communicate their approach more effectively to stakeholders, while helping team members understand dependencies and timelines, ultimately delivering greater project transparency and methodological rigor.
Quantitative research, qualitative research, mixed-methods studies, systematic reviews, and experimental designs all benefit from flowchart visualization. These research approaches streamline by mapping participant recruitment processes, data collection workflows, and analysis pathways, with many academic institutions and research organizations finding that visual documentation enhances methodology transparency, reduces errors, and accelerates peer review processes.
A flowchart assists in identifying research gaps by visually mapping each step, decision point, and connection within the process, revealing missing methodologies, inadequate data collection points, and overlooked validation stages. Through systematic visualization, researchers can pinpoint where additional literature reviews, participant groups, or analytical methods are needed, ultimately strengthening research validity and ensuring comprehensive coverage of their investigation objectives.
Effective research flowchart visual elements include clear geometric shapes for different process types, consistent color coding for categories, directional arrows showing workflow progression, readable fonts with appropriate sizing, and adequate white space for clarity. These design components work together by reducing cognitive load, enhancing information hierarchy, and enabling quick comprehension, with many researchers finding that strategic visual consistency ultimately delivers faster stakeholder understanding and improved research communication across complex methodological processes.
Research flowchart templates can be customized by modifying methodology steps, terminology, decision points, and outcome measures to align with specific disciplinary requirements and research approaches. Medical research might emphasize patient screening and ethical approvals, while market research focuses on sampling methods and data validation, with many academic institutions finding that field-specific customization streamlines research planning and enhances methodological rigor.
Color coding enhances research flowchart functionality by categorizing process stages, distinguishing data types, highlighting decision points, indicating priority levels, and showing workflow directions. Through strategic color application, researchers streamline navigation, reduce cognitive load, and accelerate comprehension, with many academic institutions and corporate research teams finding that systematic color schemes ultimately improve collaboration efficiency and minimize procedural errors.
Researchers can use flowcharts to communicate findings by simplifying complex methodologies, visualizing data relationships, highlighting key decision points, and creating logical narrative flows that guide audiences through conclusions step-by-step. These visual tools enable non-specialists in healthcare, policy development, and corporate research to grasp intricate studies more readily, ultimately enhancing knowledge transfer and decision-making across organizations.
**INPUT**: What software tools are recommended for creating professional research flowcharts? **OUTPUT**: Professional research flowchart software includes Microsoft Visio, Lucidchart, Draw.io, Creately, and SmartDraw, each offering specialized templates and collaboration features. These platforms streamline research visualization by providing drag-and-drop functionality, real-time collaboration, and export capabilities, with many academic institutions and research organizations finding that cloud-based solutions enhance team productivity and presentation quality. **Word count: 58 words**
Successful research flowchart implementations include systematic literature reviews mapping search strategies and inclusion criteria, clinical trials displaying participant recruitment and randomization processes, qualitative studies showing data collection and analysis phases, meta-analyses illustrating study selection workflows, and experimental research outlining methodology steps. These visual frameworks enhance research transparency by streamlining complex procedures, enabling clearer peer review processes, and ultimately delivering improved reproducibility, with many academic journals increasingly requiring structured flowcharts for methodological clarity and scientific rigor.
Collaborative platforms enhance research flowchart development by enabling real-time editing, version control, centralized feedback collection, and seamless integration of diverse expertise from multiple team members. Through cloud-based tools, research teams streamline coordination, eliminate communication bottlenecks, and accelerate project timelines, with many academic institutions and corporate research departments finding that collaborative workflows ultimately deliver more comprehensive methodologies and faster research outcomes.
Feedback enables researchers to identify gaps, clarify methodologies, and strengthen logical connections within their research flowchart, ensuring comprehensive coverage of all critical steps. Through peer review and stakeholder input, research teams can refine their approaches, eliminate redundancies, and enhance data collection strategies, ultimately delivering more robust findings and streamlined research processes.
A research flowchart streamlines academic publishing reviews by providing clear decision points, standardized evaluation criteria, and systematic progression paths that reduce reviewer confusion and inconsistency. Through visual workflow mapping, journals can accelerate manuscript processing, minimize editorial bottlenecks, and enhance transparency, with many academic institutions finding that structured review templates ultimately deliver faster publication timelines and improved quality control.
Common pitfalls include overcomplicating the process flow, skipping decision points, failing to define clear start and end stages, neglecting feedback loops, and using inconsistent symbols or terminology. These design flaws often result in confusion during actual research execution, with many academic institutions and market research firms finding that streamlined templates with standardized notation significantly enhance project clarity and team collaboration.
Cultural differences significantly impact research flowchart design through varying communication styles, hierarchical structures, decision-making processes, and visual interpretation preferences across different regions. International research teams increasingly adapt their flowcharts by incorporating culturally appropriate symbols, sequential logic patterns, and stakeholder engagement methods, with many multinational organizations finding that localized flowchart designs enhance participant comprehension and data quality across diverse cultural contexts.
-
Innovative and Colorful designs.
-
Impressive templates. Designing a presentation is fun now!