

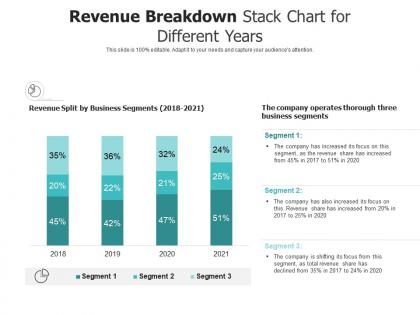
Revenue breakdown stack chart for different years




Try Before you Buy Download Free Sample Product
 Impress Your
Audience
 100%
Editable
 Save Hours
of Time


Our Revenue Breakdown Stack Chart For Different Years are topically designed to provide an attractive backdrop to any subject. Use them to look like a presentation pro.
People who downloaded this PowerPoint presentation also viewed the following :
Revenue breakdown stack chart for different years with all 2 slides:
Use our Revenue Breakdown Stack Chart For Different Years to effectively help you save your valuable time. They are readymade to fit into any presentation structure.


FAQs for Revenue breakdown stack chart
So you're basically looking at product lines, geographic regions, customer segments, and sales channels. It's like cutting a pie different ways to see what's actually working. Maybe break it down by subscription vs one-time sales too, or B2B vs B2C if that fits your business. What you really want to figure out is which segments are growing, which ones are tanking, and which are just sitting there doing nothing. Honestly, I'd just start with whatever breakdown makes the most sense for spotting your growth opportunities and red flags. Don't overthink it at first.
Honestly, revenue breakdown is a game changer for figuring out where to actually spend your time. Split things up by product, customer type, sales channel, whatever makes sense. You'll probably find some weird stuff - like that tiny product nobody talks about is making bank. Short bursts work better than long analysis sessions, trust me on this one. Focus on your winners and stop wasting energy on the dead weight. Pick whatever breakdown feels most relevant to your goals right now and just start there. The patterns become obvious pretty fast once you dig in.
So basically, multiple revenue streams are like your backup plan when shit hits the fan. One stream tanks? You've still got others keeping you afloat. Subscriptions are pretty solid since they're predictable, but seasonal stuff can be all over the place. I learned this the hard way tbh - used to rely on just one main thing and it sucked when that market went sideways. Map out what you're currently doing and see which ones actually make decent money versus the ones that are just... there. Don't spread yourself too thin though.
Pie charts work for revenue proportions, but honestly they get messy fast with too many slices. Bar charts are way better when you're comparing different time periods or want people to instantly see your winners. Stacked bars are perfect for quarterly stuff - shows total growth AND how each segment did. Oh, and waterfall charts? They're amazing for that "here's how we got from point A to point B" story. Just keep your colors consistent and put your biggest money-maker first to hook people right away.
Honestly, SaaS and retail are like night and day revenue-wise. With SaaS you get that sweet predictable monthly cash from subscriptions - way easier to forecast. Retail though? Good luck with that. One month you're killing it during holidays, next month everyone's broke after New Year's. MRR and churn rates matter way more in SaaS since customers stick around longer. Retail's all about inventory turnover and those brutal seasonal swings. Plus SaaS margins are insane once you get past the initial dev costs - no physical goods eating your profits. Just make sure you're not comparing your SaaS metrics to retail benchmarks or vice versa.
Yeah, seasonality totally messes with your revenue breakdown. Like retail goes crazy in Q4 with holiday shopping, but travel companies make their money in summer. Agriculture follows harvest cycles - no surprises there, obviously. SaaS might spike in January when everyone's got fresh budgets, while construction basically dies in winter. Here's the thing though - it's not just total revenue that changes. Your whole product mix shifts around too. You'll want to track this stuff for 2-3 years to see what's actually consistent vs just random. Makes forecasting way less of a guessing game.
Start with your main product lines or services - think "Software" vs "Consulting" or whatever makes sense for you. Then break those down by customer type (enterprise, small biz, etc.) and regions if that matters. I'd honestly keep it super basic at first. Too many companies go nuts with complicated category trees right off the bat and then their reports become impossible to read. You can always add more detail later as things grow. Trust me, your finance people will love you for it, and you won't need a decoder ring just to figure out where your money's coming from.
Looking at where your money actually comes from is huge for spotting opportunities. Like if 60% of revenue is from just two products, that's both concerning and exciting - figure out what makes them work and copy it. You'll also catch underperforming stuff that maybe just needs better marketing or more investment. Honestly, I was surprised how clear seasonal trends become when you break it down month by month. Just start simple: group your revenue by product, customer type, or sales channel. Then look for the biggest gaps in performance - that's where the magic happens.
Start with the obvious stuff - total revenue, then break it down by product lines and customer segments. Monthly and quarterly comparisons are clutch for catching trends early. I'd definitely add average deal size and customer acquisition costs since executives eat that up. Oh, and if you've got recurring revenue, separate that from one-time sales - makes a huge difference. Geographic breakdowns help too depending on your business. Charts are your friend here; nobody wants to stare at spreadsheets. Honestly, keep it simple at first. You can always dive deeper once people start asking specific questions in meetings.
Your pricing basically controls who's driving your revenue. Price high? You'll make more per sale but lose the budget crowd. Go cheap and you'll grab market share from price-sensitive customers, but then you need way more sales to hit your numbers. Think of it like - do you want to sell a few $6 lattes or a million $2 ones? Honestly, most companies mess this up by not actually knowing what their segments will pay. Map your price tiers to what people are willing to spend in each segment, then watch how your revenue mix changes when you tweak things. Start by figuring out which segments give you 80% of your money.
Don't slice your data into a million tiny pieces that just confuse everyone. Make sure you're comparing similar stuff too - like don't compare summer sales to winter unless it actually makes sense for your business. People do this constantly and then can't figure out why nothing adds up. Also, raw numbers can be super misleading. Sure, revenue looks great, but what if your best customer segment is quietly dying? Percentages and trends over time will save you from missing those red flags. Trust me on this one.
Dude, breaking down your revenue by segment is a game changer for investor pitches. Shows you actually get how your business works instead of just spouting random totals. Which products are killing it? What channels bring in the most cash? Investors are so tired of vague presentations - this stuff makes them pay attention. You can separate recurring revenue from one-off sales too, plus show any seasonal trends. Honestly, I've seen founders get way better questions when they dive into the numbers like this. Makes you look less risky if you're not banking on just one income stream.
Look at which customer groups actually bring in the money, not just who buys the most stuff. Break down your revenue by demographics, buying habits, location - whatever matters for your business. Way more useful than just counting heads, trust me. That "small" premium segment might be generating 40% of your revenue while you're not even paying attention to them. You'll also catch segments that aren't performing well and maybe need different pricing. Just grab last quarter's revenue data and group customers by 2-3 things you actually care about. Should be pretty eye-opening.
Dude, seriously just automate this stuff. I used to waste entire Friday afternoons reconciling spreadsheets - such a nightmare. Get tools that pull straight from your CRM and payment systems automatically. Real-time categorization happens without you touching anything. The time savings are insane, plus machine learning catches weird patterns you'd totally miss. Oh and it flags anomalies too which is clutch. Start by figuring out where all your revenue data sits right now, then find integration tools to connect everything. Trust me, you'll wonder why you waited so long.
Dude, geo segmentation is a game changer for revenue analysis. Shows you exactly which regions are killing it vs totally underperforming - some of the patterns will surprise you. You can spot your cash cow markets and figure out where to double down. Also helps with resource allocation and pricing strategies since different areas have their own quirks. Honestly, the seasonal patterns alone make it worth it - like, west coast vs midwest timing is so different. Pull quarterly reports to track everything. Makes forecasting way more accurate too.
-
Great experience, I would definitely use your services further.
-
Unique and attractive product design.
-
Topic best represented with attractive design.